Business Wire News

Project estimated to save over $55,000 in electricity costs in year one

GEORGETOWN, Texas--(BUSINESS WIRE)--HOLT Renewables completed its solar panel installation at the HOLT CAT location in Georgetown as part of the company’s multi-year rollout plan to incorporate solar power into their own facilities. HOLT understands energy is the largest expense for many companies, and solar power is one of the most cost-effective and environmentally friendly solutions. By implementing solar, HOLT’s goal is to improve environmental efficiency and take control of energy costs, as well as to serve as an example to others. Since 2013, HOLT has incorporated solar in many of its retail locations across the state and at its headquarters in San Antonio.


“HOLT has a legacy of investing in innovations that help businesses grow through saving time and improving efficiency,” explained HOLT CEO and General Manager Peter J. Holt. “Installing solar panels at our own facilities helps us to gain a stronger understanding of the value this service brings to our customers.”

The Georgetown facility system size is 466.11 kWdc, consisting of 1,242 CAT 370W modules that are mounted in various ways, to include reverse tilt-up, ballasted and flush mount. The system has seven 50 kW SMA TriPower inverters and will generate an estimated 691,800 kWh/year. This project is estimated to save $55,344 in electricity costs in one year.

“We have been inspired by our partners and others alike who strive to improve their operations,” said Kevin Chavez, sales operations manager at HOLT Renewables. “Incorporating solar at other HOLT-owned facilities allows us to save money, reduce emissions and remain environmentally conscious.”

HOLT Renewables conducts a solar site assessment that analyzes utility spend and use, client facilities and feasibility, models financials, and secures engineering and procurement in order to help customers analyze and implement projects to meet their goals. HOLT Renewables’ team has decades of experience creating and constructing complex solar solutions for customers nationwide.


Contacts

Marcie Hernandez Ramsey
This email address is being protected from spambots. You need JavaScript enabled to view it.
210-630-5930

HOUSTON--(BUSINESS WIRE)--Hess Midstream LP (NYSE: HESM) (“HESM”) today announced the pricing of an underwritten public offering of an aggregate of 6,000,000 Class A shares representing limited partner interests in HESM by a subsidiary of Hess Corporation and an affiliate of Global Infrastructure Partners (the “Selling Shareholders”), at a public offering price of $21.00 per Class A share. The Selling Shareholders have granted the underwriters a 30-day option to purchase up to 900,000 additional Class A shares at the public offering price less underwriting discounts and commissions.


The gross proceeds from the sale of Class A shares by the Selling Shareholders are expected to be approximately $126,000,000. HESM will not receive any proceeds from the sale of Class A shares in the offering. The offering is scheduled to close on March 15, 2021, subject to customary closing conditions.

Goldman Sachs & Co. LLC and Citigroup are acting as joint bookrunning managers of the offering.

The offering of these securities is being made only by means of the prospectus supplement and accompanying base prospectus as filed with the Securities and Exchange Commission (the “SEC”). When available, copies of the prospectus supplement and accompanying base prospectus relating to the offering may be obtained free of charge on the SEC’s website at www.sec.gov under HESM’s name or from the underwriters of the offering as follows:

Goldman Sachs & Co. LLC
Attn: Prospectus Department
200 West Street
New York, New York 10282
Telephone: 866-471-2526
Facsimile: 212-902-9316
Email: This email address is being protected from spambots. You need JavaScript enabled to view it.

Citigroup
c/o Broadridge Financial Solutions
1155 Long Island Avenue
Edgewood, New York 11717
Telephone: 800-831-9146

The Class A shares are being offered and will be sold pursuant to an effective shelf registration statement that was previously filed with the SEC. This press release shall not constitute an offer to sell or a solicitation of an offer to buy the securities described above, nor shall there be any sale of these securities in any state or jurisdiction in which such an offer, solicitation or sale would be unlawful prior to registration or qualification under the securities laws of any such state or jurisdiction. The offering may be made only by means of a prospectus and related prospectus supplement meeting the requirements of Section 10 of the Securities Act of 1933, as amended.

About Hess Midstream LP

HESM is a fee-based, growth-oriented midstream company that operates, develops and acquires a diverse set of midstream assets to provide services to Hess Corporation and third-party customers. HESM owns oil, gas and produced water handling assets that are primarily located in the Bakken and Three Forks Shale plays in the Williston Basin area of North Dakota.

Cautionary Statement Relevant to Forward-Looking Information

This press release may include forward-looking statements within the meaning of U.S. securities laws. Words such as “anticipate,” “estimate,” “expect,” “forecast,” “guidance,” “could,” “may,” “should,” “would,” “believe,” “intend,” “project,” “plan,” “predict,” “will,” “target” and similar expressions identify forward-looking statements, which are not historical in nature. Forward-looking statements are subject to certain known and unknown risks and uncertainties that could cause actual results to differ materially from our historical experience and our current projections or expectations of future results expressed or implied by these forward-looking statements. You should keep in mind the risk factors and other cautionary statements in the filings made by HESM with the SEC, which are available to the public. HESM undertakes no obligation to, and does not intend to, update these forward-looking statements to reflect events or circumstances occurring after this press release. You are cautioned not to place undue reliance on these forward-looking statements, which speak only as of the date of this press release.


Contacts

Investors:
Jennifer Gordon
(212) 536-8244

Media:
Robert Young
(713) 496-6076

KANSAS CITY, Mo.--(BUSINESS WIRE)--Kansas City Southern (KCS) (NYSE: KSU) Executive Vice President and Chief Innovation Officer, Brian D. Hancock, will address the BofA Securities STAARS Virtual Summit 2021 via webcast on March 22, 2021 at 9:05 a.m. Eastern Time. Interested investors may access the webcasts on KCS’ website at investors.kcsouthern.com. A link to the replay will be available following the event.


Headquartered in Kansas City, Mo., Kansas City Southern (KCS) (NYSE: KSU) is a transportation holding company that has railroad investments in the U.S., Mexico and Panama. Its primary U.S. holding is The Kansas City Southern Railway Company, serving the central and south central U.S. Its international holdings include Kansas City Southern de Mexico, S.A. de C.V., serving northeastern and central Mexico and the port cities of Lázaro Cárdenas, Tampico and Veracruz, and a 50 percent interest in Panama Canal Railway Company, providing ocean-to-ocean freight and passenger service along the Panama Canal. KCS' North American rail holdings and strategic alliances are primary components of a railway network, linking the commercial and industrial centers of the U.S., Mexico and Canada. More information about KCS can be found at www.kcsouthern.com.


Contacts

KCS: Ashley Thorne, 816-983-1530, This email address is being protected from spambots. You need JavaScript enabled to view it.

Contribution to extension of FCVs’ cruising range

KIYOSU, Japan--(BUSINESS WIRE)--Toyoda Gosei Co., Ltd. (TOKYO: 7282) received the Technology & Development Award from Toyota Motor Corporation for the development of high pressure hydrogen tanks used on the new MIRAI, launched by Toyota in December 2020.


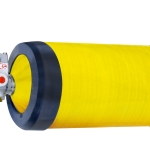
High pressure hydrogen tanks are a crucial component for fuel cell vehicles (FCVs), which efficiently hold hydrogen compressed at high pressure (about 700 atm). The new MIRAI is equipped with three hydrogen tanks, one more than the previous model, to extend its cruising range. This is an issue that is important for the widespread adoption of FCVs. Toyoda Gosei produces the third high pressure hydrogen tank*, which is located in the rear of the new MIRAI, while Toyota continues to produce the other two.

Toyoda Gosei developed the new tank together with Toyota Motor Corporation. For the new tanks, improvements have been made in the materials used in the carbon fiber reinforced plastic layer, one of the three layers of the tank wall (layer to withstand high pressure), production methods and other factors. As a result, the hydrogen storage efficiency of the tank, which is the ratio of the mass of stored hydrogen to the mass of the tank, was increased about 10 percent by minimizing the wall thickness to increase the inner volume while maintaining the pressure resistance strength.

Toyoda Gosei will continue to develop products leveraging its core technologies of rubber and plastic with the aim of supporting the spread of electrified vehicles such as electric vehicles (EVs) and FCVs.

* The production started from November 2020 at the Inabe Plant (Inabe, Mie prefecture, Japan) which was established as a dedicated plant for high pressure hydrogen tanks.


Contacts

Toyoda Gosei Co., Ltd.
Contact: Takatomo Abe
This email address is being protected from spambots. You need JavaScript enabled to view it.

HOUSTON--(BUSINESS WIRE)--$HESM--Hess Midstream LP (NYSE: HESM) (“HESM”) today announced the commencement of an underwritten public offering of an aggregate of 6,000,000 Class A shares representing limited partner interests in HESM by a subsidiary of Hess Corporation and an affiliate of Global Infrastructure Partners (the “Selling Shareholders”). The Selling Shareholders intend to grant the underwriters a 30-day option to purchase up to 900,000 additional Class A shares. HESM will not receive any proceeds from the sale of Class A shares in the offering.


Goldman Sachs & Co. LLC and Citigroup are acting as joint bookrunning managers of the offering.

The offering of these securities is being made only by means of the prospectus supplement and accompanying base prospectus as filed with the Securities and Exchange Commission (the “SEC”). When available, copies of the preliminary prospectus supplement and accompanying base prospectus relating to the offering may be obtained free of charge on the SEC’s website at www.sec.gov under HESM’s name or from the underwriters of the offering as follows:

Goldman Sachs & Co. LLC
Attn: Prospectus Department
200 West Street
New York, New York 10282
Telephone: 866-471-2526
Facsimile: 212-902-9316
E-mail: This email address is being protected from spambots. You need JavaScript enabled to view it.

Citigroup
c/o Broadridge Financial Solutions
1155 Long Island Avenue
Edgewood, New York 11717
Telephone: 800-831-9146

The Class A shares are being offered and will be sold pursuant to an effective shelf registration statement that was previously filed with the SEC. This press release shall not constitute an offer to sell or a solicitation of an offer to buy the securities described above, nor shall there be any sale of these securities in any state or jurisdiction in which such an offer, solicitation or sale would be unlawful prior to registration or qualification under the securities laws of any such state or jurisdiction. The offering may be made only by means of a prospectus and related prospectus supplement meeting the requirements of Section 10 of the Securities Act of 1933, as amended.

About Hess Midstream LP

HESM is a fee-based, growth-oriented midstream company that operates, develops and acquires a diverse set of midstream assets to provide services to Hess Corporation and third-party customers. HESM owns oil, gas and produced water handling assets that are primarily located in the Bakken and Three Forks Shale plays in the Williston Basin area of North Dakota.

Cautionary Statement Relevant to Forward-Looking Information

This press release may include forward-looking statements within the meaning of U.S. securities laws. Words such as “anticipate,” “estimate,” “expect,” “forecast,” “guidance,” “could,” “may,” “should,” “would,” “believe,” “intend,” “project,” “plan,” “predict,” “will,” “target” and similar expressions identify forward-looking statements, which are not historical in nature. Forward-looking statements are subject to certain known and unknown risks and uncertainties that could cause actual results to differ materially from our historical experience and our current projections or expectations of future results expressed or implied by these forward-looking statements. You should keep in mind the risk factors and other cautionary statements in the filings made by HESM with the SEC, which are available to the public. HESM undertakes no obligation to, and does not intend to, update these forward-looking statements to reflect events or circumstances occurring after this press release. You are cautioned not to place undue reliance on these forward-looking statements, which speak only as of the date of this press release.


Contacts

Investors:
Jennifer Gordon
(212) 536-8244

Media:
Robert Young
(713) 496-6076

DUBLIN--(BUSINESS WIRE)--The "Algae Biofuels - Global Market Trajectory & Analytics" report has been added to ResearchAndMarkets.com's offering.


Global Algae Biofuels Market to Reach $11.4 Billion by 2027

Amid the COVID-19 crisis, the global market for Algae Biofuels estimated at US$ 6.8 Billion in the year 2020, is projected to reach a revised size of US$ 11.4 Billion by 2027, growing at a CAGR of 7.5% over the period 2020-2027.

Transportation, one of the segments analyzed in the report, is projected to record 7.8% CAGR and reach US$ 8.1 Billion by the end of the analysis period. After an early analysis of the business implications of the pandemic and its induced economic crisis, growth in the Other Applications segment is readjusted to a revised 6.9% CAGR for the next 7-year period.

The U.S. Market is Estimated at $1.8 Billion, While China is Forecast to Grow at 11.4% CAGR

The Algae Biofuels market in the U.S. is estimated at US$ 1.8 Billion in the year 2020. China, the world`s second largest economy, is forecast to reach a projected market size of US$ 2.5 Billion by the year 2027 trailing a CAGR of 11.4% over the analysis period 2020 to 2027.

Among the other noteworthy geographic markets are Japan and Canada, each forecast to grow at 4.1% and 6.7% respectively over the 2020-2027 period. Within Europe, Germany is forecast to grow at approximately 4.9% CAGR.

Key Topics Covered:

I. METHODOLOGY

II. EXECUTIVE SUMMARY

1. MARKET OVERVIEW

  • Influencer Market Insights
  • World Market Trajectories
  • Impact of Covid-19 and a Looming Global Recession
  • Global Competitor Market Shares
  • Algae Biofuels Competitor Market Share Scenario Worldwide (in %): E
  • Global Competitor Market Shares by Segment

2. FOCUS ON SELECT PLAYERS (Total 34 Featured):

  • Algae Systems
  • AlgaEnergy
  • Algenol
  • Blue Marble Production
  • Cellana
  • Culture Biosystems
  • Culture Biosystems
  • Genifuels
  • Origin Oils Inc.
  • Production Systems

3. MARKET TRENDS & DRIVERS

4. GLOBAL MARKET PERSPECTIVE

  • World Current & Future Analysis for Algae Biofuels by Geographic Region - USA, Canada, Japan, China, Europe, Asia-Pacific, Latin America, Middle East and Africa Markets - Independent Analysis of Annual Sales in US$ Million for Years 2020 through 2027 and % CAGR
  • World Historic Review for Algae Biofuels by Geographic Region - USA, Canada, Japan, China, Europe, Asia-Pacific, Latin America, Middle East and Africa Markets - Independent Analysis of Annual Sales in US$ Million for Years 2012 through 2019 and % CAGR
  • World 15-Year Perspective for Algae Biofuels by Geographic Region - Percentage Breakdown of Value Sales for USA, Canada, Japan, China, Europe, Asia-Pacific, Latin America, Middle East and Africa Markets for Years 2012, 2020 & 2027
  • World Current & Future Analysis for Transportation by Geographic Region - USA, Canada, Japan, China, Europe, Asia-Pacific, Latin America, Middle East and Africa Markets - Independent Analysis of Annual Sales in US$ Million for Years 2020 through 2027 and % CAGR
  • World Historic Review for Transportation by Geographic Region - USA, Canada, Japan, China, Europe, Asia-Pacific, Latin America, Middle East and Africa Markets - Independent Analysis of Annual Sales in US$ Million for Years 2012 through 2019 and % CAGR
  • World 15-Year Perspective for Transportation by Geographic Region - Percentage Breakdown of Value Sales for USA, Canada, Japan, China, Europe, Asia-Pacific, Latin America, Middle East and Africa for Years 2012, 2020 & 2027
  • World Current & Future Analysis for Other Applications by Geographic Region - USA, Canada, Japan, China, Europe, Asia-Pacific, Latin America, Middle East and Africa Markets - Independent Analysis of Annual Sales in US$ Million for Years 2020 through 2027 and % CAGR
  • World Historic Review for Other Applications by Geographic Region - USA, Canada, Japan, China, Europe, Asia-Pacific, Latin America, Middle East and Africa Markets - Independent Analysis of Annual Sales in US$ Million for Years 2012 through 2019 and % CAGR
  • World 15-Year Perspective for Other Applications by Geographic Region - Percentage Breakdown of Value Sales for USA, Canada, Japan, China, Europe, Asia-Pacific, Latin America, Middle East and Africa for Years 2012, 2020 & 2027

III. MARKET ANALYSIS

IV. COMPETITION

  • Total Companies Profiled: 34

For more information about this report visit https://www.researchandmarkets.com/r/1xnpwk


Contacts

ResearchAndMarkets.com
Laura Wood, Senior Press Manager
This email address is being protected from spambots. You need JavaScript enabled to view it.

For E.S.T Office Hours Call 1-917-300-0470
For U.S./CAN Toll Free Call 1-800-526-8630
For GMT Office Hours Call +353-1-416-8900

THE WOODLANDS, Texas--(BUSINESS WIRE)--Earthstone Energy, Inc. (NYSE: ESTE) (“Earthstone”, the “Company”, “we” or “us”), today announced financial and operating results for the quarter and year ended December 31, 2020.


Fourth Quarter 2020 Highlights

  • Signed Purchase and Sale Agreement on the IRM Acquisition(1) on December 17, 2020 which was closed on January 7, 2021
  • Average daily production of 14,809 Boepd(2)
  • Adjusted EBITDAX(3) of $29.8 million ($21.87 per Boe)
  • Operating portion of net cash received in settlement of derivative contracts of $8.4 million
  • Free Cash Flow(3) of $8.4 million
  • Capital expenditures of $20.3 million
  • Reduction of long-term debt of $15.0 million
  • Net loss of $18.4 million or $0.28 per Adjusted Diluted Share(3)
    • Adjusted net income of $5.8 million or $0.09 per Adjusted Diluted Share(3)

Full Year 2020 Highlights

  • Average daily production of 15,276 Boepd(2)
  • Adjusted EBITDAX(2) of $144.2 million ($25.80 per Boe)
  • Operating portion of net cash received in settlement of derivative contracts of $56.0 million
  • Free Cash Flow(2) of $72.2 million
  • Capital expenditures of $66.8 million
  • Reduction of long-term debt of $55.0 million
  • Net loss of $29.4 million or $0.45 per Adjusted Diluted Share(3)
    • Adjusted net income of $30.0 million or $0.46 per Adjusted Diluted Share(3)

(1)

On January 7, 2021, Earthstone, Earthstone Energy Holdings, LLC, a subsidiary of the Company, Independence Resources Holdings, LLC, and Independence Resources Manager, LLC executed a Purchase and Sale Agreement dated December 17, 2020 (the “IRM Acquisition”).

(2)

Represents reported sales volumes.

(3)

See “Non-GAAP Financial Measures” section below.

Management Comments

Mr. Robert J. Anderson, President and CEO of Earthstone, commented, “In 2020, Earthstone achieved excellent results and delivered on its commitment to maintain balance sheet strength, operating efficiency and a persistent focus on identifying strategic and accretive growth opportunities. We overcame the unprecedented challenges of 2020 and finished the year in stronger position by managing to increase total production 14% and hold Adjusted EBITDAX almost flat compared to 2019, all while reducing our capital expenditures by 68% and utilizing free cash flow to reduce leverage, defined as total debt to Adjusted EBITDAX, from 1.2x in 2019 to 0.8x in 2020.

By completing the acquisition of Independence Resource Management, LLC (“IRM”) on January 7, 2021, we have increased our scale with complementary and accretive assets that, similar to our existing assets, carry a low-cost structure in order to further drive free cash flow generation and with drilling inventory that will deliver attractive returns in 2021. We intend to execute on our goals to maintain financial strength, capital efficiency and operating excellence while continuing to seek further strategic growth opportunities.”

Operational Update

The Company recently commenced its 2021 drilling program with the deployment of a rig in Midland County. After drilling on a three-well pad in the Hamman project, the Company expects to drill a four-well pad on the recently acquired IRM Spanish Pearl project. The Company anticipates moving the rig to Upton County and drilling 10-11 wells. Consistent with previously released guidance, the Company anticipates drilling 16 gross / 14.8 net operated wells and spudding an additional 5 gross / 3.7 net operated wells during 2021.

The Company recently completed 5 gross / 3.7 net wells in Upton County and anticipates turning these wells to sales before the end of March. The Company anticipates completing and turning to sales a total of 16 gross / 13.5 net operated wells in 2021, as is consistent with previously released guidance.

The unprecedented weather in February created production challenges for all facets of the industry including producers, mid-stream and gathering companies and refiners. While production has returned to previous levels, we do expect that production and revenue reductions will have an impact on first quarter results.

Selected Financial Data (unaudited)

($000s except where noted)

Three Months Ended


Years Ended


December 31,


December 31,


2020


2019


2020


2019

Total revenues

$

36,675


$

66,788


$

144,523


$

191,262


Lease operating expense

7,160


8,198


29,131


28,683


General and administrative expense (excluding stock-based compensation)

6,229


5,696


18,179


18,963


Stock-based compensation (non-cash)

2,389


1,968


10,054


8,648


General and administrative expense

$

8,618


$

7,664


$

28,233


$

27,611


Net (loss) income

$

(18,381)


$

(5,640)


$

(29,434)


$

1,580


Less: Net (loss) income attributable to noncontrolling interest

(9,910)


(3,016)


(15,887)


861


Net (loss) income attributable to Earthstone Energy, Inc.

(8,471)


(2,624)


(13,547)


719


Net (loss) income per common share(1)


Basic

(0.28)


(0.09)


(0.45)


0.02


Diluted

(0.28)


(0.09)


(0.45)


0.02


Adjusted EBITDAX(2)

$

29,798


$

49,893


$

144,246


$

146,273


Production(3):


Oil (MBbls)

660


1,059


3,180


3,086


Gas (MMcf)

2,251


1,442


7,282


4,760


NGL (MBbls)

327


317


1,198


1,022


Total (MBoe)(4)

1,362


1,617


5,591


4,902


Average Daily Production (Boepd)

14,809


17,571


15,276


13,429


Average Prices:


Oil ($/Bbl)

41.43


56.92


37.85


55.71


Gas ($/Mcf)

1.65


1.24


1.18


0.82


NGL ($/Bbl)

17.18


14.92


13.03


15.09


Total ($/Boe)

26.92


41.31


25.85


39.02


Adj. for Realized Derivatives Settlements:


Oil ($/Bbl)

54.21


58.67


54.95


59.82


Gas ($/Mcf)

1.67


1.48


1.42


1.49


NGL ($/Bbl)

17.18


14.92


13.03


15.09


Total ($/Boe)

33.15


42.68


35.89


42.26


Operating Margin per Boe


Average realized price(5)

$

26.92


$

41.31


$

25.85


$

39.02


Lease operating expense

5.26


5.07


5.21


5.85


Production and ad valorem taxes

1.62


2.39


1.68


2.42


Operating margin per Boe

20.04


33.85


18.96


30.75


Realized hedge settlements

6.23


1.37


10.04


3.24


Operating margin per Boe (including realized hedge settlements)

$

26.27


$

35.22


$

29.00


$

33.99


(1)

Net (loss) income per common share attributable to Earthstone Energy, Inc.

(2)

See “Non-GAAP Financial Measures” section below.

(3)

Represents reported sales volumes.

(4)

Barrels of oil equivalent have been calculated on the basis of six thousand cubic feet (Mcf) of natural gas equals one barrel of oil equivalent (Boe).

(5)

Includes $2.1 million of cash proceeds related to hedges unwound during the first quarter of 2019.

Liquidity Update

As of December 31, 2020, we had $1.5 million in cash and $115 million of long-term debt outstanding under our credit facility with a borrowing base of $240 million. With the $125 million of undrawn borrowing base capacity and $1.5 million in cash, we had total liquidity of approximately $126.5 million.

On January 7, 2021, Earthstone closed the IRM Acquisition. When adjusting to include the IRM Acquisition, we had an estimated $15.3 million in cash and $260 million outstanding under our credit facility, as amended, with a borrowing base of $360 million. With the $100 million of undrawn borrowing base capacity and $15.3 million in cash, we had total liquidity of approximately $115.3 million on a combined basis. When adjusted to include the impact of the IRM Acquisition, combined leverage at December 31, 2020 was 1.2x.

As of March 1, 2021, we had $10.1 million in cash and $227.5 million of long-term debt outstanding under our credit facility, as amended, with a borrowing base of $360 million. With the $132.5 million of undrawn borrowing base capacity and $10.1 million in cash, we had total liquidity of approximately $142.6 million.

Capital Expenditures

During 2020, we incurred capital expenditures of approximately $66.8 million, on an accrual basis, primarily consisting of drilling and completion costs. We recently commenced our drilling program with the deployment of a rig this month and we expect to spend $90-$100 million in total capital expenditures based on our current 2021 capital spending plan.

Hedge Position

Hedging Activities

The following table sets forth our outstanding derivative contracts at December 31, 2020. When aggregating multiple contracts, the weighted average contract price is disclosed.

Period


Commodity


Volume
(Bbls / MMBtu)


Price
($/Bbl / $/MMBtu)

2021


Crude Oil Swap


2,294,000


$51.17

2021


Crude Oil Basis Swap (1)


1,825,000


$1.05

2022


Crude Oil Swap


365,000


$47.70

2021


Natural Gas Swap


4,380,000


$2.76

2021


Natural Gas Basis Swap (2)


4,380,000


$(0.45)

(1)

The basis differential price is between WTI Midland Argus Crude and the WTI NYMEX.

(2)

The basis differential price is between W. Texas (WAHA) and the Henry Hub NYMEX.

Upon closing of the IRM Acquisition on January 7, 2021, Earthstone assumed the hedges that IRM had in place consisting of approximately 1,008,950 Bbls of oil at $41.07/Bbl.

Hedging Update

The following table sets forth our outstanding derivative contracts at March 4, 2021. When aggregating multiple contracts, the weighted average contract price is disclosed.

Period


Commodity


Volume
(Bbls / MMBtu)


Price
($/Bbl / $/MMBtu)

2021


Crude Oil Swap


3,326,750


$48.04

2021


Crude Oil Basis Swap (1)


2,857,750


$0.79

2021


Crude Oil Basis Swap (2)


1,032,750


$(0.26)

2022


Crude Oil Swap


1,458,500


$52.96

2022


Crude Oil Basis Swap (1)


1,368,750


$0.74

2021


Natural Gas Swap


6,912,000


$2.81

2021


Natural Gas Basis Swap (3)


6,912,000


$(0.37)

Q1 2022


Natural Gas Swap


450,000


$2.97

Q1 2022


Natural Gas Basis Swap (3)


450,000


$(0.23)

(1)

The basis differential price is between WTI Midland Argus Crude and the WTI NYMEX.

(2)

The swap is between WTI Roll and the WTI NYMEX.

(3)

The basis differential price is between W. Texas (WAHA) and the Henry Hub NYMEX.

Conference Call Details

Earthstone is hosting a conference call on Thursday, March 11, 2021 at 10:00 a.m. Eastern (9:00 a.m. Central) to discuss the Company’s operations and financial results for the fourth quarter and full year 2020 and its outlook for 2021. Prepared remarks by Robert J. Anderson, President and Chief Executive Officer, Mark Lumpkin, Jr., Executive Vice President and Chief Financial Officer and Steven C. Collins, Executive Vice President, Operations, will be followed by a question-and-answer session.

Investors and analysts are invited to participate in the call by dialing 877-407-6184 for domestic calls or 201-389-0877 for international calls, in both cases asking for the Earthstone conference call. A webcast will also be available through the Company's website (www.earthstoneenergy.com). Please select "Events & Presentations" under the "Investors" section of the Company's website and log on at least 10 minutes in advance to register.

A replay of the call will be available on the Company’s website and by telephone until 10:00 a.m. Eastern (9:00 a.m. Central), Thursday, March 25, 2021. The number for the replay is 877-660-6853 for domestic calls or 201-612-7415 for international calls, using Replay ID: 13717242.

About Earthstone Energy, Inc.

Earthstone Energy, Inc. is a growth-oriented, independent energy company engaged in acquisition, development and operation of oil and natural gas properties. The Company’s assets are located in the Midland Basin of west Texas and the Eagle Ford trend of south Texas. Earthstone is listed on the NYSE under the symbol “ESTE”. For more information, visit the Company’s website at www.earthstoneenergy.com.

Forward-Looking Statements

This release contains forward-looking statements within the meaning of Section 27A of the Securities Act of 1933, as amended (the “Securities Act”), and Section 21E of the Securities Exchange Act of 1934, as amended (the “Exchange Act”). Statements that are not strictly historical statements constitute forward-looking statements and may often, but not always, be identified by the use of such words such as “expects,” “believes,” “intends,” “anticipates,” “plans,” “estimates,” “guidance,” “target,” “potential,” “possible,” or “probable” or statements that certain actions, events or results “may,” “will,” “should,” or “could” be taken, occur or be achieved. Forward-looking statements are based on current expectations and assumptions and analyses made by Earthstone and its management in light of experience and perception of historical trends, current conditions and expected future developments, as well as other factors appropriate under the circumstances that involve various risks and uncertainties that could cause actual results to differ materially from those reflected in the statements. These risks include, but are not limited to, those set forth in Earthstone’s annual report on Form 10-K for the year ended December 31, 2020 and other Securities and Exchange Commission filings. Earthstone undertakes no obligation to revise or update publicly any forward-looking statements except as required by law.

EARTHSTONE ENERGY, INC.

CONDENSED CONSOLIDATED BALANCE SHEETS (UNAUDITED)

(In thousands, except share and per share amounts)


December 31,

ASSETS

2020


2019

Current assets:


Cash

$

1,494


$

13,822


Accounts receivable:


Oil, natural gas, and natural gas liquids revenues

16,255


29,047


Joint interest billings and other, net of allowance of $19 and $83 at December 31, 2020 and 2019, respectively

7,966


6,672


Derivative asset

7,509


8,860


Prepaid expenses and other current assets

1,509


1,867


Total current assets

34,733


60,268


Oil and gas properties, successful efforts method:


Proved properties

1,017,496


970,808


Unproved properties

233,767


260,271


Land

5,382


5,382


Total oil and gas properties

1,256,645


1,236,461


Accumulated depreciation, depletion and amortization

(291,213)


(195,567)


Net oil and gas properties

965,432


1,040,894


Other noncurrent assets:


Goodwill


17,620


Office and other equipment, net of accumulated depreciation of $3,675 and $3,180 at December 31, 2020 and 2019, respectively

931


1,311


Derivative asset

396


770


Operating lease right-of-use assets

2,450


3,108


Other noncurrent assets

1,315


1,572


TOTAL ASSETS

$

1,005,257


$

1,125,543


LIABILITIES AND EQUITY


Current liabilities:


Accounts payable

$

6,232


$

25,284


Revenues and royalties payable

27,492


35,815


Accrued expenses

16,504


19,538


Asset retirement obligation

447


308


Derivative liability

1,135


6,889


Advances

2,277


11,505


Operating lease liability

773


570


Finance lease liability

69


206


Other current liability

565


43


Total current liabilities

55,494


100,158


Noncurrent liabilities:


Long-term debt

115,000


170,000


Asset retirement obligation

2,580


1,856


Derivative liability

173


Deferred tax liability

14,497


15,154


Operating lease liability

1,840


2,539


Finance lease liability

5


85


Other noncurrent liabilities

132


Total noncurrent liabilities

134,227


189,634


Equity:


Preferred stock, $0.001 par value, 20,000,000 shares authorized; none issued or outstanding


Class A Common Stock, $0.001 par value, 200,000,000 shares authorized; 30,343,421 and 29,421,131 issued and outstanding at December 31, 2020 and 2019, respectively

30


29


Class B Common Stock, $0.001 par value, 50,000,000 shares authorized; 35,009,371 and 35,260,680 issued and outstanding at December 31, 2020 and 2019, respectively

35


35


Additional paid-in capital

540,074


527,246


Accumulated deficit

(195,258)


(181,711)


Total Earthstone Energy, Inc. equity

344,881


345,599


Noncontrolling interest

470,655


490,152


Total equity

815,536


835,751


TOTAL LIABILITIES AND EQUITY

$

1,005,257


$

1,125,543


EARTHSTONE ENERGY, INC.

CONDENSED CONSOLIDATED STATEMENTS OF OPERATIONS (UNAUDITED)

(In thousands, except share and per share amounts)


Three Months Ended


Years Ended


December 31,


December 31,


2020


2019


2020


2019

REVENUES


Oil

$

27,338


$

60,268


$

120,355


$

171,925


Natural gas

3,712


1,787


8,567


3,913


Natural gas liquids

5,625


4,733


15,601


15,424


Total revenues

36,675


66,788


144,523


191,262


OPERATING COSTS AND EXPENSES


Lease operating expense

7,160


8,198


29,131


28,683


Production and ad valorem taxes

2,213


3,870


9,411


11,871


Rig idle and termination expense


426


Impairment expense

1,950


64,498


Depreciation, depletion and amortization

20,318


26,962


96,414


69,243


General and administrative expense

8,618


7,664


28,233


27,611


Transaction costs

946


279


622


1,077


Accretion of asset retirement obligation

170


54


307


214


Exploration expense


653


298


653


Total operating costs and expenses

41,375


47,680


229,340


139,352


Gain on sale of oil and gas properties, net

6


3,668


204


3,222


(Loss) income from operations

(4,694)


22,776


(84,613)


55,132


OTHER INCOME (EXPENSE)


Interest expense, net

(1,025)


(1,831)


(5,232)


(6,566)


Write-off of deferred financing costs


(1,242)


(1,242)


(Loss) gain on derivative contracts, net

(13,166)


(24,311)


59,899


(43,983)


Other income (expense), net

280


(95)


400


(96)


Total other (expense) income

(13,911)


(27,479)


55,067


(51,887)


(Loss) income before income taxes

(18,605)


(4,703)


(29,546)


3,245


Income tax benefit (expense)

224


(937)


112


(1,665)


Net (loss) income

(18,381)


(5,640)


(29,434)


1,580


Less: Net (loss) income attributable to noncontrolling interest

(9,910)


(3,016)


(15,887)


861


Net (loss) income attributable to Earthstone Energy, Inc.

$

(8,471)


$

(2,624)


$

(13,547)


$

719


Net (loss) income per common share attributable to Earthstone Energy, Inc.:


Basic

$

(0.28)


$

(0.09)


$

(0.45)


$

0.02


Diluted

$

(0.28)


$

(0.09)


$

(0.45)


$

0.02


Weighted average common shares outstanding:


Basic

30,212,191


29,278,455


29,911,625


28,983,354


Diluted

30,212,191


29,278,455


29,911,625


29,360,885


EARTHSTONE ENERGY, INC.

CONDENSED CONSOLIDATED STATEMENTS OF CASH FLOWS (UNAUDITED)

(In thousands)


For the Years Ended December 31,


2020


2019

Cash flows from operating activities:


Net (loss) income

$

(29,434)


$

1,580


Adjustments to reconcile net (loss) income to net cash provided by operating activities:


Impairment of proved and unproved oil and gas properties

46,878


Depreciation, depletion and amortization

96,414


69,243


Accretion of asset retirement obligations

307


214


Impairment of Goodwill

17,620


Gain on sale of oil and gas properties, net

(204)


(3,222)


Settlement of asset retirement obligations

(195)


(374)


Total (gain) loss on derivative contracts, net

(59,899)


43,983


Operating portion of net cash received in settlement of derivative contracts

56,044


15,866


Stock-based compensation

10,054


8,648


Deferred income taxes

(657)


1,665


Write-off of deferred financing costs


1,242


Amortization of deferred financing costs

322


412


Changes in assets and liabilities:


(Increase) decrease in accounts receivable

11,914


(18,035)


(Increase) decrease in prepaid expenses and other current assets

(203)


66


Increase (decrease) in accounts payable and accrued expenses

481


(10,438)


Increase (decrease) in revenues and royalties payable

(8,323)


7,067


Increase (decrease) in advances

(9,617)


8,331


Net cash provided by operating activities

131,502


126,248


Cash flows from investing activities:


Additions to oil and gas properties

(88,097)


(204,268)


Additions to office and other equipment

(114)


(527)


Proceeds from sales of oil and gas properties

414


4,184


Net cash used in investing activities

(87,797)


(200,611)


Cash flows from financing activities:


Proceeds from borrowings

136,056


234,680


Repayments of borrowings

(191,056)


(143,508)


Cash paid related to the exchange and cancellation of Class A Common Stock

(836)


(1,135)


Cash paid for finance leases

(130)


(392)


Deferred financing costs

(67)


(1,836)


Net cash (used in) provided by financing activities

(56,033)


87,809


Net increase (decrease) in cash

(12,328)


13,446


Cash at beginning of period

13,822


376


Cash at end of period

$

1,494


$

13,822


Supplemental disclosure of cash flow information


Cash paid for:


Interest

$

4,588


$

6,405


Non-cash investing and financing activities:


Accrued capital expenditures

$

7,328


$

28,356


Lease asset additions - ASC 842

$


$

3,722


Asset retirement obligations

$

762


$

105


Earthstone Energy, Inc.
Non-GAAP Financial Measures
Unaudited

The non-GAAP financial measures of Adjusted Diluted Shares, Adjusted EBITDAX, Adjusted Net Income, All-In Cash Costs, Free Cash Flow and Operating Margin per Boe, as defined and presented below, are intended to provide readers with meaningful information that supplements our financial statements prepared in accordance with accounting principles generally accepted in the United States (“GAAP”). Further, these non-GAAP measures should only be considered in conjunction with financial statements and disclosures prepared in accordance with GAAP and should not be considered in isolation or as a substitute for GAAP measures, such as net income or loss, operating income or loss or any other GAAP measure of financial position or results of operations. Adjusted EBITDAX and Adjusted Net Income are presented herein and reconciled from the GAAP measure of net (loss) income because of its wide acceptance by the investment community as a financial indicator.

I. Adjusted Diluted Shares

We define “Adjusted Diluted Shares” as the weighted average shares of Class A Common Stock - Diluted outstanding plus the weighted average shares of Class B Common Stock outstanding.

Our Adjusted Diluted Shares measure provides a comparable per share measurement when presenting results such as Adjusted EBITDAX and Adjusted Net Income that include the interests of both Earthstone and the noncontrolling interest. Adjusted Diluted Shares is used in calculating several metrics that we use as supplemental financial measurements in the evaluation of our business, none of which should be considered as an alternative to, or more meaningful than, net income as an indicator of operating performance.

Adjusted Diluted Shares for the periods indicated:


Three Months Ended


Years Ended


December 31,


December 31,


2020


2019


2020


2019

Class A Common Stock - Diluted

30,212,191


29,278,455


29,911,625


29,360,885


Class B Common Stock

35,009,371


35,288,526


35,077,711


35,395,021


Adjusted Diluted Shares

65,221,562


64,566,981


64,989,336


64,755,906


II. Adjusted EBITDAX

The non-GAAP financial measure of Adjusted EBITDAX (as defined below), as calculated by us below, is intended to provide readers with meaningful information that supplements our financial statements prepared in accordance with GAAP. Further, this non-GAAP measure should only be considered in conjunction with financial statements and disclosures prepared in accordance with GAAP and should not be considered in isolation or as a substitute for GAAP measures, such as net income or loss, operating income or loss or any other GAAP measure of financial position or results of operations.


Contacts

Mark Lumpkin, Jr.
Executive Vice President – Chief Financial Officer
Earthstone Energy, Inc.
1400 Woodloch Forest Drive, Suite 300
The Woodlands, TX 77380
281-298-4246
This email address is being protected from spambots. You need JavaScript enabled to view it.

Scott Thelander
Vice President of Finance
Earthstone Energy, Inc.
1400 Woodloch Forest Drive, Suite 300
The Woodlands, TX 77380
281-298-4246
This email address is being protected from spambots. You need JavaScript enabled to view it.


Read full story here

ODENSE, Denmark--(BUSINESS WIRE)--Inrotech has received an order for an extensive set of welding robots for shipbuilding in the United States. The Inrotech-MicroTwin and Inrotech-Crawler were purchased by Halter Marine in Pascagoula, Miss., and will be used during construction of United States Coast Guard’s new Polar Security Cutter. The 460-foot vessel will support U.S. national interests in Arctic and Antarctic waters.


Inrotech’s standard welding robots fits into Halter Marine’s production needs to efficiently weld the Polar Security Cutter along with a variety of ocean-going vessels.

“We are honored to be part of this strategic cooperation with Halter Marine,” said Thomas Bøgner, Sales Director of Inrotech. “To enhance robotic welding solutions with Halter Marine is an important step for both parties, and we are absolutely committed to nothing else than successful operation.”

The robots will be integrated and implemented in Halter Marine’s production in order to reduce manhours, increase welding quality and improve productivity. Inrotech’s welding robots usually substitutes 4-5 welders per shift per robot.

“Among other things, we ensure an improved competitiveness for Halter Marine, just as we ensure a clearly improved working environment for several welding workers,” says Thomas Bøgner.

In addition to shipyards, Inrotech’s intelligent and mobile robotic welding systems is the obvious choice for in the offshore industry, green energy sector and manufacturers of heavy-duty steel structures.

Inrotech is a Danish company which is born out of the shipbuilding industry and today shipbuilding is still the main market. Instead of huge gantries with large and heavy semi-stationary robots, which were operating in dedicated production areas where the large components were transported in order to be welded, Inrotech chose the other way around: Making small, mobile robot solutions, which can be moved to or even into the existing production layout.

Without compromising welding efficiency, this solution offered several advantages to the traditional gantry-based solutions: lower cost, less transport of large structures and flexibility to move to different working areas.

Inrotech has delivered highly feasible welding robots of wind-towers, steel structures such as bridges and other applications worldwide but also for Hydro plants.

The company's success is based on a unique technology combination of mobile welding automation and a user-friendly software. With the growing demand for quality welding, requirements for improvement of working environment, lack of skilled welders, Inrotech see a huge potential market for robot welding solutions.

Press Photos


Contacts

Press Coordinator for Inrotech:
Malene Grouleff, This email address is being protected from spambots. You need JavaScript enabled to view it., +45 28915809

AKRON, Ohio--(BUSINESS WIRE)--$BW #BabcockWilcox--Babcock & Wilcox Enterprises, Inc. ("B&W") (NYSE: BW) has been invited to participate in the 33rd Annual Roth Conference, which is being held virtually March 15-17, 2021.


B&W management is scheduled to hold one-on-one meetings throughout the conference. To learn more or submit a registration request, visit https://ibn.fm/ROTH2021Registration. To schedule a one-on-one meeting, please email This email address is being protected from spambots. You need JavaScript enabled to view it..

About the Roth Conference

The 33rd Annual Roth Conference is an invitation-only virtual event that will feature presentations from public and private companies across a variety of industry sectors. During previous events, ROTH has hosted close to 550 participating companies and attracted more than 5,000 attendees, including institutional investors, analysts, family offices and high-net-worth investors.

About B&W Enterprises

Headquartered in Akron, Ohio, Babcock & Wilcox Enterprises is a leader in energy and environmental products and services for power and industrial markets worldwide. Follow us on LinkedIn and learn more at www.babcock.com.


Contacts

Investors:
Megan Wilson
Vice President, Corporate Development & Investor Relations
Babcock & Wilcox
704.625.4944 | This email address is being protected from spambots. You need JavaScript enabled to view it.

Media:
Ryan Cornell
Public Relations
Babcock & Wilcox
330.860.1345 | This email address is being protected from spambots. You need JavaScript enabled to view it.

Highly innovative augmented intelligence SaaS platform strengthens customers’ ability to make global trade frictionless

MANCHESTER, England & HOLLAND, Mich.--(BUSINESS WIRE)--BluJay Solutions, a leading provider of global supply chain software and services, announces the launch of Augmented Global Trade (AGT) platform, a multi-tenant SaaS platform that enhances and automates the end-to-end customs and compliance requirements for international trade. For logistics service providers, carriers, and shippers managing complex customs declarations, as well as shippers that need to assert control over a network of brokers and freight forwarders, BluJay’s Augmented Global Trade platform streamlines workflow, decreases risk, and accelerates efficiency for international trade operations.


BluJay’s Augmented Global Trade platform leverages the company’s innovative “augmented intelligence” to supplement users, making experienced traders even more efficient while giving newer users the tools to be more effective, more quickly.

“Our new Augmented Global Trade platform is designed to augment the user’s input and intelligence, providing actionable customs and compliance workflow with dashboard visibility from a single user experience,” said David Landau, Chief Product Officer at BluJay Solutions. “BluJay’s AGT delivers an advantage for companies looking to digitize and consolidate the typically manual, disconnected processes and multiple systems associated with managing cross-border trade.”

Nicolas Ethevenin, Director Product Management, adds that AGT is scalable, offering flexibility for customers. “In addition to organizing workflows, BluJay’s AGT platform is engineered to connect external partners, systems, and processes. This enables our customers to adapt to changing requirements and scale, while reducing errors, delays, and fines that can prove costly to their bottom line.”

BluJay's AGT platform provides intuitive automation with purpose-built solutions and real-time connectivity to trading partners in a single platform. Among the applications hosted in the AGT platform are:

Command Center – a new actionable dashboard that provides visibility to international shipments’ customs and compliance status. The traders’ control tower, Command Center displays color-coded alerts that enable users to spot potential issues before they occur and take action directly from the alert. Trigger the creation of a declaration with a click, and shipment, leg, party master, and item master data is consolidated into a Unified Customs Schema (UCS) message that is transformed into a declaration within AGT or sent to a third-party for processing.

Global Trade Item Master – a new solution to extend and tailor data to support trade compliance, with out-of-the-box dataset support for global trade and customs declarations and the ability to save data elements at a country level, including classification codes and customer-specific data. Global Trade Item Master's purpose-built central repository enables users to store and communicate data easily in a consistent, consumable manner for relevant parties.

Smart Classification – a new tool to streamline the labor-intensive task of product classification with any combination of three automation strategies: HS Quick Classification, Classification by Rules, or Classification by Key Words. With Smart Classification, users avoid costly delays and fines associated with improper classification.

Customs Management-Global – BluJay’s multi-country electronic customs declaration solution with a self-updating compliance engine and coverage for more than 20 countries, with new procedures included in every major software release. Customs Management-ZABIS®, BluJay’s electronic, NCTS-certified customs solution in Germany, is also accessible from CM-Global and AGT-enabled.

Restricted Party Screening – an application to run compliance checks via transactional Spot Screening or automated Community Screening, which monitors changes in content and master data.

“We’re excited to see customers benefit from even greater efficiency using the full breadth of capabilities available in BluJay’s Augmented Global Trade,” says Ethevenin.

For more information, visit customs.blujaysolutions.com.

About BluJay Solutions

BluJay Solutions helps companies around the world achieve excellence in logistics and trade compliance - it’s in our DNA. Through a blend of Data, Networks, and Applications, delivered in the BluJay Way, our DNA platform powers the Frictionless Supply Chain for thousands of the world’s leading manufacturers, retailers, distributors, freight forwarders, customs brokers, carriers, and logistics service providers. To learn more, visit: www.blujaysolutions.com, or follow us on Twitter @myblujay and LinkedIn.


Contacts

Martha de Labbey, +1 781-418-2400
This email address is being protected from spambots. You need JavaScript enabled to view it.

Strong Free Cash Flow Generation From Low Breakevens & Capital Efficiency

Expanded Work Program Accelerates Profitable Growth In 2021

BOGOTA, Colombia--(BUSINESS WIRE)--GeoPark Limited (“GeoPark” or the “Company”) (NYSE: GPRK), a leading independent Latin American oil and gas explorer, operator and consolidator with operations and growth platforms in Colombia, Ecuador, Chile, Brazil and Argentina reports its consolidated financial results for the three-month period (“Fourth Quarter” or “4Q2020”) and for the year ended December 31, 2020 (“Full-year” or “FY2020”). A conference call to discuss 4Q2020 and FY2020 financial results will be held on March 11, 2021 at 10:00 am (Eastern Standard Time).


All figures are expressed in US Dollars and growth comparisons refer to the same period of the prior year, except when specified. Definitions and terms used herein are provided in the Glossary at the end of this document. This release does not contain all of the Company’s financial information and should be read in conjunction with GeoPark’s consolidated financial statements and the notes to those statements for the year ended December 31, 2020, available on the Company’s website.

FOURTH QUARTER AND FULL-YEAR 2020 HIGHLIGHTS

Profitable Production Growth

  • Annual average production of 40,192 boepd in 2020, extending 18-year track record
  • Consolidated oil and gas production of 39,304 boepd
  • CPO-5 block (GeoPark non-operated, 30% WI) produced 10,310 bopd gross, 55% higher than 3Q2020

Free Cash Flow Generation

  • Revenue of $106.7 million / Full-year Revenue of $393.7 million
  • Cash flow from operations of $77.1 million / Full-year Cash flow from operations of $168.7 million
  • Adjusted EBITDA of $56.0 million / Full-year Adjusted EBITDA of $217.5 million
  • Full-year non-cash accounting impairments in Chile, Peru, Argentina and Brazil of $133.9 million and write-offs of $52.7 million for an operating loss of $110.7 million / Full-year Net loss of $233.0 million
  • Capital expenditures of $26.1 million / Full-year 2020 work program of $75.3 million

Cost and Capital Efficiencies

  • Cost and investment reductions of over $290 million1 across regional platform
  • Full-year Production and operating costs reduced by 26% to $125.1 million
  • Full-Year G&G, G&A and selling expenses reduced by 24% to $71.1 million

Strong Risk-Managed Balance Sheet

  • $201.9 million of Cash & cash equivalents as of Dec. 31, 2020 ($111.2 million as of Dec. 31, 2019)
  • $75 million oil prepayment facility, with $50 million committed and no amounts drawn
  • $125.6 million in uncommitted credit lines
  • Long-term financial debt maturity profile with no bond principal payments until September 2024
  • Continuously adding new hedges for the next 12 months

Fully Funded Growth in 2021 Work Program

  • Expanding full-year 2021 work program to $130-150 million (from prior $100-120 million), targeting 41,000-43,0002 boepd average production and operating netbacks of $330-370 million assuming Brent at $50-55 per bbl3
  • Flexible work program, quickly adaptable to any oil price scenario

Returning Value to Shareholders

  • Quarterly cash dividend of $0.0205 per share ($1.25 million) to be paid on April 13, 2021, to the shareholders of record at the close of business on March 31, 2021
  • Resumed cash dividends, having paid $4.9 million in full-year 2020 (quarterly and extraordinary)
  • Resumed discretionary share buyback program, having acquired 119,289 shares for $1.2 million since November 6, 2020, totaling $4.0 million in full-year 2020

Decisive Actions on SPEED/ESG+

  • Exceeded all Health and Safety goals in 2020
  • Obtained Bureau Veritas certification on biosecurity protocols to mitigate and manage the impact of Covid-19 in GeoPark Colombia in June and again in December 2020
  • Signed contract to connect the Llanos 34 block (GeoPark operated, 45% WI) to the national electricity grid, which has 68% installed hydroelectric capacity. The electrification of Llanos 34 is expected to be operational in 2022, and will help reduce carbon emissions and the cost of energy
  • Connected the Tigana field (Llanos 34 block) to the ODCA pipeline in December 2020, further reducing truck traffic by an estimated 205 trucks per day, contributing to further reduce operational risk, costs and carbon emissions

Big Expansion Fairway

  • Certified 2P reserves of 175 mmboe with a net present value (after tax) of $2.5 billion
  • 199% 2P reserve replacement in Colombia (including acquisitions)
  • Net debt-adjusted 2P NPV10 after tax of $31.3 per share ($25.5 per share corresponding to Colombia)
  • Exploration inventory of 380-780 mmbbl4 potential recoverable resources in Colombia

James F. Park, Chief Executive Officer of GeoPark, said: “After such a historically-complex year and the exceptional efforts by our team to prevail through and succeed during 2020 – we must again express our gratitude and admiration to the GeoPark women and men that made this all possible and continued us along our 18-year growth trajectory. We kept our teams safe and healthy, we operated in the field without interruption for 365 days, we grew production, we found more oil and gas, we beat down each and every cost, we funded all our work and obligations with our own cashflow, we acquired and integrated a new company, we completely restructured our asset portfolio and organization, we strengthened our balance sheet and almost doubled our cash, we provided aid and support to our neighboring communities, we moved to reduce our carbon footprint and social and environmental impacts, and we reinstated our shareholder value initiatives with share buybacks and cash dividends. Bottom-line: GeoPark is a better and stronger Company today and well-positioned for the promising opportunities ahead. 2021 is already well underway with three drilling rigs at work, seismic being run to identify new prospects on our high-potential acreage, and our team fully engaged in getting every molecule of hydrocarbons safely, cleanly and profitably out of the ground and to market.”

CONSOLIDATED OPERATING PERFORMANCE

Key performance indicators:

Key Indicators

4Q2020

3Q2020

4Q2019

FY2020

FY2019

Oil productiona (bopd)

33,238

32,875

35,456

34,860

34,442

Gas production (mcfpd)

36,390

35,814

37,971

31,992

33,624

Average net production (boepd)

39,304

38,845

41,786

40,192

40,046

Brent oil price ($ per bbl)

46.0

43.3

62.4

43.2

64.2

Combined realized price ($ per boe)

31.7

27.9

43.6

28.4

45.7

⁻ Oil ($ per bbl)

35.5

31.7

48.7

31.2

50.7

⁻ Gas ($ per mcf)

3.0

2.5

4.2

3.0

4.5

Sale of crude oil ($ million)

97.5

89.3

144.4

359.6

579.0

Sale of gas ($ million)

9.2

8.8

13.7

34.1

49.9

Revenue ($ million)

106.7

98.1

158.1

393.7

628.9

Commodity risk management contracts ($ million)

-17.5

2.7

-6.5

8.1

-22.5

Production & operating costsb ($ million)

-34.9

-28.4

-42.3

-125.1

-169.0

G&G, G&Ac and selling expenses ($ million)

-21.7

-14.4

-29.9

-71.1

-93.5

Adjusted EBITDA ($ million)

56.0

56.1

85.7

217.5

363.3

Adjusted EBITDA ($ per boe)

16.6

15.9

23.6

15.7

26.4

Operating Netback ($ per boe)

22.2

19.2

31.0

19.9

32.5

Net Profit (loss) ($ million)

-119.2

-4.3

-0.2

-233.0

57.8

Capital expenditures ($ million)

26.1

9.8

38.1

75.3

126.3

Amerisur acquisitiond ($ million)

-

-

-

272.3

-

Cash and cash equivalents ($ million)

201.9

163.7

111.2

201.9

111.2

Short-term financial debt ($ million)

17.7

4.8

17.3

17.7

17.3

Long-term financial debt ($ million)

766.9

767.4

420.1

766.9

420.1

Net debt ($ million)

582.7

608.4

326.2

582.7

326.2

a) Includes royalties paid in kind in Colombia for approximately 986, 1,284 and 1,587 bopd in 4Q2020, 3Q2020 and 4Q2019 respectively. No royalties were paid in kind in Chile, Brazil or Argentina.

b) Production and operating costs include operating costs and royalties paid in cash.

c) G&A and G&G expenses include non-cash, share-based payments for $2.3 million, $1.8 million and $1.3 million in 4Q2020, 3Q2020 and 4Q2019, respectively. These expenses are excluded from the Adjusted EBITDA calculation.

d) Amerisur acquisition is shown net of cash acquired.

REVISED 2021 WORK PROGRAM

Resulting from a sustained increase in oil prices since early November 2020, GeoPark is expanding its 2021 work program and investment plan to $130-150 million (from $100-120 million), maintaining full flexibility to expand or adjust depending on prevailing oil prices.

The revised 2021 work program reflects an average production of 41,000-43,0001 boepd (excluding potential production from the 2021 exploration drilling program), which includes drilling of 37-42 gross wells, with approximately 60-65% to be allocated to development activities and 35-40% to exploration activities.

Using a $50-55/bbl Brent assumption, GeoPark can execute a risk-balanced work program to continue growing its business by producing, developing and exploring its portfolio of assets, fully funded within cashflow, maintaining a strong balance sheet and returning value to its shareholders.

The table below provides further details about GeoPark’s revised 2021 work program compared to its November 4, 2020 guidance.

2021 Work Program

Revised6 ($50-55/bbl Brent)

Previous ($40-45/bbl Brent)

Average Production5

41,000-43,000 boepd

40,000-42,000 boepd

Total 2021 Capital Expenditures

$130-150 million

$100-120 million

Development Capital

$75-90 million

$60-70 million

Operating Netback

$330-370 million

$210-280 million

Development/Appraisal Wells (Gross)

30-34 wells

26-28 wells

Exploration Wells (Gross)

7-8 wells

5-6 wells

Total Wells (Gross)

37-42 wells

31-34 wells

Operating Netback to Capital Expenditures Ratio7

2.5x

2.2x

Production: Annual average 2020 production of 40,192 boepd compared to 40,046 boepd in 2019. Oil and gas production in 4Q2020 decreased by 6% to 39,304 boepd from 41,786 boepd in 4Q2019, due to limited drilling and maintenance activities in Colombia, Chile and Argentina and lower gas demand in Brazil, partially offset by the addition of production from the Amerisur acquisition in Colombia. Oil represented 85% of total reported production in 4Q2020 and 4Q2019.

For further details, please refer to the 4Q2020 Operational Update published on January 7, 2021.

Reference and Realized Oil Prices: Brent crude oil prices averaged $46.0 per bbl during 4Q2020, $16.4 per bbl lower than 4Q2019 levels. However, consolidated realized oil sales price averaged $35.5 per bbl in 4Q2020, $13.2 per bbl lower than the $48.7 per bbl in 4Q2019, reflecting a lower local marker differential in Colombia and lower commercial and transportation discounts.

In Colombia, the local marker differential to Brent averaged $2.3 per bbl in 4Q2020, compared to $3.2 per bbl in 4Q2019. Commercial and transportation discounts averaged $8.4 per bbl in 4Q2020, compared to $10.6 per bbl in 4Q2019, resulting from further improvements achieved for production in the Llanos 34 block plus the addition of the Platanillo (GeoPark operated, 100% WI) and CPO-5 blocks as part of the Amerisur acquisition, both of which have lower commercial and transportation discounts.

The tables below provide a breakdown of reference and net realized oil prices in Colombia, Chile and Argentina in 4Q2020 and 4Q2019:

4Q2020 - Realized Oil Prices

($ per bbl)

Colombia

Chile

Argentina

Brent oil price (*)

46.0

45.6

46.0

Local marker differential

(2.3)

-

-

Commercial, transportation discounts & Other

(8.4)

(7.8)

(5.0)

Realized oil price

35.3

37.8

41.0

Weight on oil sales mix

95%

1%

4%

4Q2019 - Realized Oil Prices

($ per bbl)

Colombia

Chile

Argentina

Brent oil price (*)

62.4

63.2

62.4

Local marker differential

(3.2)

-

-

Commercial, transportation discounts & Other

(10.6)

(7.2)

(14.6)

Realized oil price

48.6

56.0

47.8

Weight on oil sales mix

94%

2%

4%

(*) Specified Brent oil price differs in each country as sales are priced with different Brent reference prices.

Revenue: Consolidated revenue decreased by 33% to $106.7 million in 4Q2020, compared to $158.1 million in 4Q2019 reflecting lower oil and gas prices and lower deliveries.

Sales of crude oil: Consolidated oil revenue decreased by 32% to $97.5 million in 4Q2020, driven by a 27% decrease in realized oil prices and an 8% decrease in oil deliveries. Oil revenue was 91% of total revenue in 4Q2020 and 4Q2019.

  • Colombia: In 4Q2020, oil revenue decreased by 32% to $91.6 million reflecting lower realized oil prices and a 7% decrease in oil deliveries. Realized prices decreased by 27% to $35.3 per bbl due to lower Brent oil prices, partially compensated by lower commercial and transportation discounts and a lower Vasconia differential. Oil deliveries decreased by 7% to 29,324 bopd, reflecting temporary shut-ins and limited drilling and maintenance activity in previous quarters of 2020. Colombian earn-out payments decreased by 42% to $3.6 million in 4Q2020, compared to $6.1 million in 4Q2019, in line with lower oil revenue in the Llanos 34 block.
  • Chile: In 4Q2020, oil revenue decreased by 46% to $1.3 million, due to lower oil prices and volumes sold. Realized oil prices decreased by 33% to $37.8 per bbl, in line with lower Brent prices. Oil deliveries decreased by 20% to 383 bopd due to limited maintenance works and no drilling activity, combined with the natural decline of the fields.
  • Argentina: In 4Q2020, oil revenue decreased by 32% to $4.4 million due to lower oil prices and lower deliveries. Realized oil prices decreased by 14% to $41.0 per bbl, and oil deliveries decreased by 21% to 1,171 bopd due to limited maintenance works and no drilling activity, combined with the natural decline of the fields.

Sales of gas: Consolidated gas revenue decreased by 33% to $9.2 million in 4Q2020 compared to $13.7 million in 4Q2019 reflecting 30% lower gas prices and an 4% decrease in volumes delivered. Gas revenue was 9% of total revenue in both 4Q2020 and 4Q2019.

  • Chile: In 4Q2020, gas revenue decreased by 35% to $3.5 million reflecting lower gas prices, partially offset by higher gas deliveries. Gas prices were 39% lower, or $2.3 per mcf ($13.7 per boe) in 4Q2020. The successful development of the Jauke gas field and the discovery of the Jauke Oeste gas field in early 2020 increased gas deliveries by 5% to 16,565 mcfpd (2,761 boepd).
  • Brazil: In 4Q2020, gas revenue decreased by 33% to $4.5 million, due to lower gas deliveries and lower gas prices. Gas deliveries fell by 20% in the Manati gas field (GeoPark non-operated, 10% WI) to 11,706 mcfpd (1,951 boepd) due to lower gas demand in Brazil. Gas prices decreased by 16% to $4.2 per mcf ($24.9 per boe), due to the impact of the local currency devaluation, which was partially offset by the annual price inflation adjustment of approximately 7%, effective in January 2020.
  • Argentina: In 4Q2020, gas revenue decreased by 41% to $0.6 million, resulting from lower gas prices, partially offset by higher deliveries. Gas prices decreased by 49% to $1.6 per mcf ($9.8 per boe) due to local market conditions while deliveries increased by 14% to 4,251 mcfpd (708 boepd) due to optimization activities focused on enhancing base production levels and the improved performance of the Challaco Bajo gas field.

Commodity Risk Management Contracts: Consolidated commodity risk management contracts amounted to a $17.5 million loss in 4Q2020, compared to a $6.5 million loss in 4Q2019.

Commodity risk management contracts have two different components, a realized and an unrealized portion.

The realized portion of the commodity risk management contracts registered a cash gain of $5.3 million in 4Q2020 compared to zero in 4Q2019. Realized gains in 4Q2020 resulted from hedges in place providing protection from prevailing oil prices during 4Q2020.

The unrealized portion of the commodity risk management contracts amounted to a $22.8 million loss in 4Q2020, compared to a $6.5 million loss in 4Q2019. Unrealized losses during 4Q2020 resulted from the increase in the forward Brent oil price curve compared to September 30, 2020 and the impact of new hedges added during 4Q2020, as measured at December 31, 2020.

GeoPark recently added new oil hedges that further increased its low-price risk protection over the next 12 months. Please refer to the “Commodity Risk Oil Management Contracts” section below for a description of hedges in place as of the date of this release.

Production and Operating Costs8: Consolidated production and operating costs decreased by 18% to $34.9 million from $42.3 million resulting from lower royalties and lower operating costs.

The table below provides a breakdown of production and operating costs in 4Q2020 and 4Q2019:

(In millions of $)

4Q2020

4Q2019

Operating costs

22.9

25.7

Royalties

11.6

16.6

Share-based payments

0.4

-

Production and operating costs

34.9

42.3

Consolidated operating costs decreased by 10%, or $2.7 million to $22.9 million in 4Q2020 compared to $25.7 million in 4Q2019.

The breakdown of operating costs is as follows:

  • Colombia: Operating costs per boe increased to $6.5 in 4Q2020 compared to $5.2 in 4Q2019. Total operating costs increased by 6% and amounted to $16.5 million, due to higher well maintenance costs plus the addition of the Platanillo block as part of the Amerisur acquisition, which has higher costs per boe than the Llanos 34 block.
  • Chile: Operating costs per boe decreased by 36% to $8.9 in 4Q2020 compared to $13.9 in 4Q2019, due to successful cost reduction efforts (including lower well intervention activities, efficiencies and the renegotiation of existing contracts). Total operating costs decreased by 35% to $2.6 million in 4Q2020 from $4.0 million in 4Q2019, in line with lower operating costs per boe and flat oil and gas deliveries.
  • Brazil: Operating costs per boe remained flat at $7.6 in 4Q2020 compared to $7.5 in 4Q2019. Total operating costs decreased by 32% to $0.9 million in 4Q2020 compared to $1.3 million in 4Q2019, reflecting lower gas deliveries in Manati gas field, which decreased by 20%.
  • Argentina: Operating costs per boe decreased by 29% to $18.5 in 4Q2020 compared to $26.0 in 4Q2019 due to ongoing cost-reduction efforts (including lower well intervention activities, efficiencies and the renegotiation of existing contracts) and to a lesser extent, due to the devaluation of the local currency. Total operating costs decreased by 37% to $3.1 million in 4Q2020 compared to $4.9 million in 4Q2019 due to lower operating costs per boe and lower oil and gas deliveries, which decreased by 11%.

Consolidated royalties fell by 30% or $5.0 million to $11.6 million in 4Q2020 compared to $16.6 million in 4Q2019, mainly resulting from lower oil and gas prices.

Selling Expenses: Consolidated selling expenses decreased by $1.9 million to $0.9 million in 4Q2020 (of which $0.7 million, or $0.2 per bbl, correspond to Colombia), compared to $2.8 million in 4Q2019.

Administrative Expenses: Consolidated G&A costs per boe decreased by 25% to $4.29 in 4Q2020 compared to $5.5 in 4Q2019 due to cost reduction initiatives that outweighed the incremental G&A costs related to the addition of Amerisur operations. Total consolidated G&A decreased by $5.3 million to $16.0 million in 4Q2020, compared to $21.3 million in 4Q2019.

Geological & Geophysical Expenses: Consolidated G&G costs per boe decreased by 26% to $1.410 in 4Q2020 versus $1.9 in 4Q2019 due to ongoing cost reduction initiatives and despite incremental G&G costs related to the addition of Amerisur operations. Total consolidated G&G expenses decreased to $4.8 million in 4Q2020 compared to $5.7 million in 4Q2019.

Adjusted EBITDA: Consolidated Adjusted EBITDA11 decreased by 35% to $56.0 million, or $16.6 per boe, in 4Q2020 compared to $85.7 million, or $23.6 per boe, in 4Q2019.

  • Colombia: Adjusted EBITDA of $60.5 million in 4Q2020
  • Chile: Adjusted EBITDA of $0.3 million in 4Q2020
  • Brazil: Adjusted EBITDA of $2.2 million in 4Q2020
  • Argentina: Adjusted EBITDA of negative $1.7 million in 4Q2020
  • Corporate, Ecuador and Peru: Adjusted EBITDA of negative $5.3 million in 4Q2020

The table below shows production, volumes sold and the breakdown of the most significant components of Adjusted EBITDA for 4Q2020 and 4Q2019, on a per country and per boe basis:

Adjusted EBITDA/boe

Colombia

Chile

Brazil

Argentina

Total


4Q20

4Q19

4Q20

4Q19

4Q20

4Q19

4Q20

4Q19

4Q20

4Q19

Production (boepd)

31,858

33,311

3,133

3,292

2,167

2,799

2,146

2,384

39,304

41,786

Inventories, RIKa & Other

(2,329)

(1,653)

11

(194)

(187)

(218)

(266)

(278)

(2,771)

(2,343)

Sales volume (boepd)

29,529

31,658

3,144

3,098

1,980

2,581

1,880

2,106

36,533

39,443

% Oil

99.3%

99.4%

12%

15%

1%

5%

62%

71%

85%

85%

($ per boe)


Realized oil price

35.3

48.6

37.8

56.0

43.2

67.7

41.0

47.8

35.5

48.7

Realized gas priceb

31.3

29.3

13.7

22.3

24.9

29.8

9.8

19.1

17.7

25.3

Earn-out

(1.3)

(2.1)

-

-

-

-

-

-

(1.1)

(2.0)

Combined Price

33.9

46.4

16.6

27.5

25.2

31.7

29.3

39.4

31.7

43.6

Realized commodity risk management contracts

2.0

-

-

-

-

-

-

-

1.6

-

Operating costs

(6.5)

(5.2)

(8.9)

(13.9)

(7.6)

(7.5)

(18.5)

(26.0)

(7.4)

(7.2)

Royalties in cash

(3.8)

(5.0)

(0.6)

(1.0)

(2.0)

(2.8)

(4.5)

(6.0)

(3.4)

(4.6)

Selling & other expenses

(0.2)

(0.9)

(0.3)

(0.3)

-

-

(1.2)

(1.2)

(0.3)

(0.8)

Operating Netback/boe

25.4

35.3

6.9

12.3

15.6

21.3

5.2

6.2

22.2

31.0

G&A, G&G & other


(5.6)

(7.4)

Adjusted EBITDA/boe


16.6

23.6

a) RIK (Royalties in kind). Includes royalties paid in kind in Colombia for approximately 986 and 1,587 bopd in 4Q2020 and 4Q2019 respectively. No royalties were paid in kind in Chile, Brazil or Argentina.

b) Conversion rate of $mcf/$boe=1/6.

Depreciation: Consolidated depreciation charges remained flat at $28.8 million in 4Q2020, compared to $28.7 million in 4Q2019, in line with lower volumes delivered and higher depreciation costs per boe resulting from the Amerisur acquisition.

Write-off of unsuccessful exploration efforts: The consolidated write-off of unsuccessful exploration efforts amounted to $48.9 million in 4Q2020 compared to $9.0 million in 4Q2019. Amounts recorded in 4Q2020 include $46.6 million related to exploration costs incurred in prior years in the Tierra del Fuego and Fell blocks in Chile, plus costs associated with unsuccessful exploration projects in Colombia, including the Aguila exploration prospect in the CPO-5 block and re-entry costs related to the Grulla 1 well in the Llanos 94 block (GeoPark non-operated, 50% WI).

Impairment of Non-Financial Assets: Consolidated non-cash impairment of non-financial assets amounted to $35.4 million in 4Q2020 ($31.7 million recorded in the Fell block in Chile, $3.0 million in the Morona block in Peru and $0.7 million in the REC-T-128 block in Brazil) mainly related to costs incurred in previous years. A non-cash impairment loss is recognized for the amount by which an asset’s carrying amount exceeds its recoverable amount.

For further details, please refer to Note 37 of GeoPark’s consolidated financial statements as of December 31, 2020, available on the Company’s website.

Other Income (Expenses): Other operating expenses showed a $2.7 million loss in 4Q2020, compared to a $2.4 million loss in 4Q2019.

CONSOLIDATED NON-OPERATING RESULTS AND PROFIT FOR THE PERIOD

Financial Expenses: Net financial expenses increased to $16.4 million in 4Q2020, compared to $12.2 million in 4Q2019 mainly resulting from higher interest expenses related to the issuance of $350 million notes due in 2027 (2027 Notes).

Foreign Exchange: Net foreign exchange charges added a $6.3 million loss in 4Q2020 compared to a $1.8 million loss in 4Q2019.

Income Tax: Income taxes totaled a $13.4 million loss in 4Q2020 compared to a $17.9 million loss in 4Q2019, mainly resulting from lower profits before income taxes and the write-down of a portion of tax losses and other deferred income tax assets in Chile, Brazil and Argentina, partially offset by the effect of fluctuations of local currencies over deferred income taxes.

Profit: Losses of $119.


Contacts

INVESTORS:
Stacy Steimel This email address is being protected from spambots. You need JavaScript enabled to view it.
Shareholder Value Director
T: +562 2242 9600
Miguel Bello This email address is being protected from spambots. You need JavaScript enabled to view it.
Market Access Director
T: +562 2242 9600
Diego Gully This email address is being protected from spambots. You need JavaScript enabled to view it.
Investor Relations Director
T: +5411 4312 9400

MEDIA:
Communications Department This email address is being protected from spambots. You need JavaScript enabled to view it.


Read full story here

The HVAC industry is moving toward more sustainable approaches in response to environmental impacts of traditional technologies


BOULDER, Colo.--(BUSINESS WIRE)--#ClimateChange--A new report from Guidehouse Insights analyzes the global HVAC market, providing market forecasts for revenue and shipments by segment and region, through 2030.

HVAC has helped to advance society, particularly in some of Earth’s hottest regions, however, its operation is a key cause of climate change. The environmental impact is driving industry and governments to seek sustainable cooling and heating solutions, such as heat pump water heaters, heat pumps, and variable speed compressors. Click to tweet: According to a new report from @WeAreGHInsights, the global HVAC market is anticipated to be $218.8 billion in 2021, growing at a compound annual growth rate (CAGR) of 3.4% from 2021 to 2030. The 2030 market size is anticipated to reach $ 296.7 billion.

“The industry has been transforming toward sustainability, showing higher efficiency and environmental friendliness,” said Young Hoon Kim, research analyst with Guidehouse Insights. “Additionally, local governments are regulating system efficiency and high global warming potential (GWP) refrigerants and innovative market players are developing highly efficient advanced products.”

While policy has often guided market growth, several non-policy drivers are also helping to bolster the market. These include cooling demand in hot places, the heat island effect, technical advancements, user-friendly functions, district heating and cooling, new business models, and new construction demand.

The report, Commercial and Residential HVAC, examines the global HVAC market, taking into consideration sustainable heating and cooling, the impact of geographic differences on the market, decarbonization policies, and emerging market trends. The report addresses market issues, including notable business cases and emerging business opportunities associated with commercial and residential segments. Global market forecasts for revenue and shipments by segment and region extend through 2030. An executive summary of the report is available for free download on the Guidehouse Insights website.

About Guidehouse Insights

Guidehouse Insights, the dedicated market intelligence arm of Guidehouse, provides research, data, and benchmarking services for today’s rapidly changing and highly regulated industries. Our insights are built on in-depth analysis of global clean technology markets. The team’s research methodology combines supply-side industry analysis, end-user primary research, and demand assessment, paired with a deep examination of technology trends, to provide a comprehensive view of emerging resilient infrastructure systems. Additional information about Guidehouse Insights can be found at www.guidehouseinsights.com.

About Guidehouse

Guidehouse is a leading global provider of consulting services to the public and commercial markets with broad capabilities in management, technology, and risk consulting. We help clients address their toughest challenges and navigate significant regulatory pressures with a focus on transformational change, business resiliency, and technology-driven innovation. Across a range of advisory, consulting, outsourcing, and digital services, we create scalable, innovative solutions that prepare our clients for future growth and success. The company has more than 8,000 professionals in over 50 locations globally. Guidehouse is a Veritas Capital portfolio company, led by seasoned professionals with proven and diverse expertise in traditional and emerging technologies, markets, and agenda-setting issues driving national and global economies. For more information, please visit: www.guidehouse.com.

* The information contained in this press release concerning the report, Commercial and Residential HVAC, is a summary and reflects the current expectations of Guidehouse Insights based on market data and trend analysis. Market predictions and expectations are inherently uncertain and actual results may differ materially from those contained in this press release or the report. Please refer to the full report for a complete understanding of the assumptions underlying the report’s conclusions and the methodologies used to create the report. Neither Guidehouse Insights nor Guidehouse undertakes any obligation to update any of the information contained in this press release or the report.


Contacts

Lindsay Funicello-Paul
+1.781.270.8456
This email address is being protected from spambots. You need JavaScript enabled to view it.

BOGOTA, Colombia--(BUSINESS WIRE)--GeoPark Limited (“GeoPark” or the “Company”) (NYSE: GPRK), a leading independent Latin American oil and gas explorer, operator and consolidator with operations and growth platforms in Colombia, Ecuador, Chile, Brazil and Argentina today announced its Board of Directors has declared its quarterly cash dividend of $0.0205 per share ($1.25 million in the aggregate) payable on April 13, 2021 to the shareholders of record at the close of business on March 31, 2021.


GeoPark plans to deliver another year of strong operational and financial performance and free cash flow generation while remaining committed to returning value to its shareholders.

NOTICE

Additional information about GeoPark can be found in the “Investor Support” section on the website at www.geo-park.com.

Certain amounts included in this press release have been rounded for ease of presentation.

CAUTIONARY STATEMENTS RELEVANT TO FORWARD-LOOKING INFORMATION

This press release contains statements that constitute forward-looking statements. Many of the forward- looking statements contained in this press release can be identified by the use of forward-looking words such as ‘‘anticipate,’’ ‘‘believe,’’ ‘‘could,’’ ‘‘expect,’’ ‘‘should,’’ ‘‘plan,’’ ‘‘intend,’’ ‘‘will,’’ ‘‘estimate’’ and ‘‘potential,’’ among others.

Forward-looking statements that appear in a number of places in this press release include, but are not limited to, statements regarding the intent, belief or current expectations, regarding various matters, including the expected future operational and financial performance and free cash flow generation. Forward-looking statements are based on management’s beliefs and assumptions, and on information currently available to the management. Such statements are subject to risks and uncertainties, and actual results may differ materially from those expressed or implied in the forward-looking statements due to various factors.

Forward-looking statements speak only as of the date they are made, and the Company does not undertake any obligation to update them in light of new information or future developments or to release publicly any revisions to these statements in order to reflect later events or circumstances, or to reflect the occurrence of unanticipated events. For a discussion of the risks facing the Company which could affect whether these forward-looking statements are realized, see filings with the U.S. Securities and Exchange Commission (SEC).


Contacts

INVESTORS:
Stacy Steimel This email address is being protected from spambots. You need JavaScript enabled to view it.
Shareholder Value Director
T: +562 2242 9600

Miguel Bello This email address is being protected from spambots. You need JavaScript enabled to view it.
Market Access Director
T: +562 2242 9600

Diego Gully This email address is being protected from spambots. You need JavaScript enabled to view it.
Investor Relations Director
T: +5411 4312 9400

MEDIA:
Communications Department This email address is being protected from spambots. You need JavaScript enabled to view it.

bp to Provide $50 million for Development and Construction of Renewable Natural Gas Production Facilities

NEWPORT BEACH, Calif.--(BUSINESS WIRE)--$CLNE #RNG--Clean Energy Fuels Corp. (Nasdaq: CLNE) today announced plans that it will work with BP Products North America Inc, a subsidiary of BP p.l.c. (NYSE: BP) to develop, own and operate new renewable natural gas (RNG) facilities at dairies and other agriculture facilities that will produce one of the cleanest fuels in the world.


Carbon emissions captured from dairies and turned into a transportation fuel reduce the harmful effects on long-term climate change. As a result, the California Air Resources Board gives these carbon-negative RNG projects a CI Score (gCO2e/MJ) of -250 (or lower) compared to 97 for diesel and 46 for electric batteries. The demand for this carbon-negative fuel has significantly accelerated over the last few years. Some of the largest heavy-duty fleets in the world such as UPS, Republic Services, New York Metropolitan Transportation Authority and LA Metro, among others, are currently and successfully operating tens of thousands of vehicles on RNG.

Clean Energy is the largest provider of RNG as a transportation fuel in the United States and Canada, the largest RNG fuel provider under the California LCFS program and currently has a joint RNG marketing agreement with bp established in 2018. In addition to the carbon-negative fuel, Clean Energy will continue to source RNG from other providers to supply its network of 550 fueling stations in North America and maintain its leadership position in the California LCFS market. This also marks another strong step in Clean Energy’s ambition to meet the rapidly growing demand by customers for carbon-negative RNG and to deliver 100% Redeem™ branded RNG to its entire fueling infrastructure by 2025, which Clean Energy is well on its way to achieving.

“Carbon-negative RNG is being used today by thousands of vehicles with more and more fleets requesting it every week,” said Andrew J. Littlefair, CEO and president of Clean Energy. “Taking this next step allows us to expand the availability of the fuel while providing dairy owners with a way to make a significant impact on the environment and create an additional revenue stream.”

Clean Energy has made noteworthy commitments to transforming the way the transportation industry powers vehicles to have less of an impact on long-term climate change and believes the use of carbon-negative RNG is the most immediate, cost-effective and has the greatest effect of any alternative. Clean Energy has already identified potential RNG-producing projects and has plans to deploy funds for development and construction expenses in 2021.

For more information, refer to Clean Energy’s Form 8-K.

About Clean Energy

Clean Energy Fuels Corp. is the leading provider of the cleanest fuel for the transportation market in the United States and Canada. Through its sales of Redeem™ renewable natural gas (RNG), which is derived from capturing biogenic methane produced from decomposing organic waste, Clean Energy allows thousands of vehicle fleets, from airport shuttles to city buses to waste and heavy-duty trucks, to reduce their amount of climate-harming greenhouse gas by at least 70% and even up to 300% depending on the source of the RNG. Clean Energy can deliver Redeem through compressed natural gas (CNG) and liquified natural gas (LNG) to its network of approximately 540 fueling stations across the U.S. and Canada. Clean Energy builds and operates CNG and LNG fueling stations for the transportation market, owns natural gas liquefication facilities in California and Texas, and transports bulk CNG and LNG to non-transportation customers around the U.S. For more information, visit www.CleanEnergyFuels.com.

Forward-Looking Statements

This press release contains forward-looking statements within the meaning of Section 27A of the Securities Act of 1933 and Section 21E of the Securities Exchange Act of 1934 that involve risks, uncertainties and assumptions, such as statements regarding, among other things: the completion and timing of the JV; Clean Energy’s plans for its RNG business; increased market adoption of carbon-negative RNG as a vehicle fuel; growth in Clean Energy’s customer base for its Redeem™ RNG vehicle fuel; the strength of Clean Energy’s vehicle fueling infrastructure and its ability to leverage this infrastructure to increase sales of Redeem™ vehicle fuel and to deliver 100% Redeem™ branded RNG to its entire fueling infrastructure by 2025; the benefits of RNG as an alternative vehicle fuel, including economic and environmental benefits; and growth in and certainty of supply of RNG. Actual results and the timing of events could differ materially from those expressed in or implied by these forward-looking statements as a result of a variety of factors, including, among others: Clean Energy’s and BP’s ability to close the JV on the timeline anticipated or at all; supply, demand, use and prices of crude oil, gasoline, diesel, natural gas and alternative fuels, as well as heavy-duty trucks and other vehicles powered by these fuels; the willingness of fleets and other consumers to adopt RNG as a vehicle fuel; and general economic, political, regulatory, market and other conditions. The forward-looking statements made in this press release speak only as of the date of this press release and Clean Energy undertakes no obligation to update publicly such forward-looking statements to reflect subsequent events or circumstances, except as otherwise required by law. Additionally, the reports and other documents Clean Energy files with the SEC (available at www.sec.gov) contain additional information on these and other risk factors that may cause actual results to differ materially from the forward-looking statements contained in this press release.


Contacts

Clean Energy Contact:
Raleigh Gerber
949-437-1397
This email address is being protected from spambots. You need JavaScript enabled to view it.

Investor Contact:
This email address is being protected from spambots. You need JavaScript enabled to view it.

HOUSTON--(BUSINESS WIRE)--Headline and release summary of release should read: NOV Inc. Announces Full Redemption of Its Outstanding 2.60% Senior Notes Due 2022 (instead of: NOV Inc. Announces Full Redemption of Its Outstanding 2.60% Senior Notes Due 2026).


The updated release reads:

NOV INC. ANNOUNCES FULL REDEMPTION OF ITS OUTSTANDING 2.60% SENIOR NOTES DUE 2022

NOV Inc. (NYSE: NOV) (the “Company”) today announced that it intends to redeem in full all $182.7 million in aggregate principal amount of its outstanding 2.60% senior notes due December 2022 (CUSIP No. 637071AJ0) (the “Notes”). The redemption will be made in accordance with the terms of the indenture governing the Notes and the terms of the notice of redemption.

The Company expects the Notes to be redeemed on April 9, 2021 (the “Redemption Date”), at a redemption price equal to par plus a make-whole premium calculated in accordance with the terms of the Notes and accrued and unpaid interest to, but not including, the Redemption Date (the “Redemption Price”). The Redemption Price will be due and payable on the Redemption Date upon surrender of the Notes. The Company intends to fund the redemption of the 2022 Notes with available cash on hand.

A notice of redemption is being mailed to all registered holders of the Notes by Wells Fargo Bank, National Association, the trustee for the Notes. Copies of the notice of redemption may be obtained from Wells Fargo by calling ‎(800) 344-5128‎.

This announcement is for informational purposes only and is not an offer to purchase or sell or a solicitation of any offer to purchase or sell, with respect to the Notes or any other securities.

About NOV

NOV delivers technology-driven solutions to empower the global energy industry. For more than 150 years, NOV has pioneered innovations that enable its customers to safely produce abundant energy while minimizing environmental impact. The energy industry depends on NOV’s deep expertise and technology to continually improve oilfield operations and assist in efforts to advance the energy transition towards a more sustainable future. NOV powers the industry that powers the world.

Visit www.nov.com for more information.

Cautionary Statement for the Purpose of the “Safe Harbor” Provisions of the Private Securities Litigation Reform Act of 1995

Statements made in this press release that are forward-looking in nature are intended to be “forward-looking statements” within the meaning of Section 27A of the Securities Act of 1933, as amended, and Section 21E of the Securities Exchange Act of 1934, as amended, and may invoke risks and uncertainties. Such statements include the Company’s ability to fund redemption of the Notes. Such forward-looking statements are subject to certain risks, uncertainties and assumptions, including prevailing market conditions and other factors. Should one or more of these risks or uncertainties materialize, or should underlying assumptions prove incorrect, actual results may vary materially from those expected. Readers are referred to documents filed by NOV Inc. with the SEC, including the Annual Report on Form 10-K for the year ended December 31, 2020, and to the extent applicable subsequently filed Quarterly Reports on Form 10-Q and Current Reports on Form 8-K, which identify significant risk factors that could cause actual results to differ from those contained in the forward-looking statements. The Company undertakes no obligation to update forward-looking statements, except as required by law.


Contacts

Blake McCarthy
Vice President, Corporate Development and Investor Relations
(713) 815-3535
This email address is being protected from spambots. You need JavaScript enabled to view it.

KNOXVILLE, Tenn.--(BUSINESS WIRE)--#5G--EnerNex, a CESI company, was recently engaged by DSTAR, a consortium of North American utilities, to develop and deliver a comprehensive study on the fifth generation (5G) digital cellular service and its potential impact on utility operations.


EnerNex has completed the study and delivered the final report which:

  • Provides an overview of the transformational technologies that make up the 5G family of services;
  • Explores the intersection of this technologies capabilities with the needs of the electric industry; and
  • Examines the impact of small cell infrastructure on utility assets such as distribution poles.

For DSTAR, the motivation for this report came from an interest from their utility members to hear from fellow utilities, telecommunications carriers, and related equipment providers and uncover their respective expectations, needs, and requirements with a focus on the impact of this technology.

The combination of research, analysis and dialog with study participants identified a number of areas of common need, dependence on standardization, and the requirement for continued collaboration.

“Emerging 5G wireless services promise last mile speeds comparable to coax and fiber, without the attachment, clearance, and right of way issues of wireline drop cables. With the demand for always connected, fixed and mobile users, 5G is happening at a faster pace than originally anticipated,” stated Ron Chebra, Vice President of Grid Modernization with EnerNex. “There are realistic and practical opportunities for electric utilities to be both users and participants in this new world of communications.”

“As the 5G conversation continues to evolve, we look forward to working with our partner utilities and members of the telecommunications industries as they work together to leverage the power of 5G technology that ultimately will provide consumers a better experience,” Paul Jakubczak, Director of Electric and Gas Systems with Fort Pierce Utilities Authority, and DSTAR project technical lead representative. “Our hope is that our members, and the industry at large, will gain an appreciation of the complexity and continuous technological innovations happening in the telecommunications industry, some of the motivation for these advancements, the markets they are targeting, and how the electric utility is or can be involved.”

For access to the report or to learn more, please visit dstar.org.

About DSTAR

DSTAR stands for Distribution Systems Testing, Application, and Research (DSTAR) which is a consortium of electric utilities, facilitated by General Electric International, Inc. through its Energy Consulting Group. Throughout its more than 30+ year history, DSTAR has provided its member utilities with results that are directly applicable to everyday distribution design, planning, engineering, operations, and maintenance. The DSTAR model offers utilities a cost-effective and responsive way to address complex distributed energy challenges that require unique and innovative solutions. The members cooperatively fund research enabling each utility to get significant research and development value out of their individual contributions. For more information on DSTAR, visit dstar.org or geenergyconsulting.com for more information.

About EnerNex

EnerNex, a CESI company, is a leader in providing engineering, consulting, and research services to the electric power industry worldwide. Founded in 2003, the company is focused on helping our clients understand, adopt and leverage new and emerging electric power technologies to advance a cleaner, smarter energy system of the future.

To learn more about CESI, a world-leading innovation, technical consulting and engineering company for the electric power sector, visit: www.cesi.it.

For more information on EnerNex:


Contacts

Media Contacts
Carrie Owens, Director of Marketing and Communications
+1 865-770-4854
This email address is being protected from spambots. You need JavaScript enabled to view it.

Bill Jabour, Product Marketing Leader & Interim-Project Coordinator for DSTAR
+1 518-949-8146
This email address is being protected from spambots. You need JavaScript enabled to view it.

TOKYO--(BUSINESS WIRE)--Toshiba Electronic Devices & Storage Corporation ("Toshiba") has launched 650V super junction power MOSFETs, TK065U65Z, TK090U65Z, TK110U65Z, TK155U65Z and TK190U65Z, in its DTMOSVI series that are housed in a TOLL (TO-leadless) package. Volume production shipments start today.


TOLL is a surface-mount package that has an approximately 27% smaller footprint than the usual D2PAK package. It is also a 4-pin type package that allows Kelvin connection of its signal source terminal for the gate drive. This can reduce the influence by the inductance of the source wire in the package to bring out the high-speed switching performance of the MOSFETs, suppressing oscillation when switching. Compared to Toshiba’s current product, TK090N65Z[1], the turn-on switching loss is reduced by about 68% and turn-off switching loss by about 56%[2][3]. The new MOSFETs are suitable for power supplies for industrial equipment such as data centers and photovoltaic power conditioners.

The combination of TOLL packaging with the latest[4] generation DTMOSVI process technology extends the line-up to cover a low On-resistance of up to 65mΩ(max)[5]. Toshiba will continue to enhance products with the TOLL package to contribute to equipment downsizing and improved efficiency.

Notes:
[1] A product in DTMOSVI series with equivalent voltage and On-resistance that uses the TO-247 package without Kelvin connection
[2] As of March 10, 2021, values measured by Toshiba (Test condition: VDD=400V, VGG=+10V/0V, ID=15A, Rg=10Ω, Ta=25℃).
[3] TK090U65Z only
[4] As of March 10, 2021
[5] TK065U65Z only

Applications

  • Data center (Server power supplies, etc.)
  • Power conditioners for photovoltaic generators
  • Uninterruptible power systems

Features

  • Thin and small surface-mount package
  • Turn-on and off switching loss are reduced by using 4-pin type package.
  • Latest[4] generation DTMOSVI series

Main Specifications

(Ta=25°C)

Part number

TK065U65Z

TK090U65Z

TK110U65Z

TK155U65Z

TK190U65Z

Package

Name

TOLL

Size typ.

(mm)

9.9x11.68, t:2.3

Absolute maximum ratings

Drain-

source

voltage

VDSS (V)

650

Drain

current

(DC)

ID (A)

38

30

24

18

15

Drain-source

On-resistance

RDS(ON) max (Ω)

@VGS=10V

0.065

0.09

0.11

0.155

0.19

Total gate charge

Qg typ. (nC)

62

47

40

29

25

Gate-drain charge

Qgd typ. (nC)

17

12

11

8

7.1

Input capacitance

Ciss typ. (pF)

3650

2780

2250

1635

1370

Channel-to-case

thermal resistance

Rth(ch-c) max (℃/W)

0.462

0.543

0.657

0.833

0.961

Conventional series (DTMOSIV)

Part number

-

-

-

TK20G60W[6]

TK16G60W[6]

Sample Check & Availability

Buy Online

Buy Online

Buy Online

Buy Online

Buy Online

Note:
[6] VDSS=600V, D2PAK package

Follow the links below for more on the new product.
TK065U65Z
TK090U65Z
TK110U65Z
TK155U65Z
TK190U65Z

Follow the link below for more on MOSFETs.
MOSFETs

To check availability of the new product at online distributors, visit:
TK065U65Z
TK090U65Z
TK110U65Z
TK155U65Z
TK190U65Z

Customer Inquiries
Power Device Sales & Marketing Department
Tel: +81-3-3457-3933
https://toshiba.semicon-storage.com/ap-en/contact.html

*Company names, product names, and service names may be trademarks of their respective companies.
*Information in this document, including product prices and specifications, content of services and contact information, is current on the date of the announcement but is subject to change without prior notice.

About Toshiba Electronic Devices & Storage Corporation

Toshiba Electronic Devices & Storage Corporation combines the vigor of a new company with the wisdom of experience. Since becoming an independent company in July 2017, the company has taken its place among the leading general devices companies, and offers its customers and business partners outstanding solutions in discrete semiconductors, system LSIs and HDD.

Its 24,000 employees around the world share a determination to maximize the value of its products, and emphasize close collaboration with customers to promote co-creation of value and new markets. The company looks forward to building on annual sales now surpassing 750-billion yen (US$6.8 billion) and to contributing to a better future for people everywhere.
Find out more about Toshiba Electronic Devices & Storage Corporation at https://toshiba.semicon-storage.com/ap-en/top.html


Contacts

Media Inquiries:
Chiaki Nagasawa
Digital Marketing Department
Toshiba Electronic Devices & Storage Corporation
Tel: +81-3-3457-4963
This email address is being protected from spambots. You need JavaScript enabled to view it.

SCHAUMBURG, Ill.--(BUSINESS WIRE)--Phoenix Exteriors, a premier roofing and solar energy company headquartered in Schaumburg, Illinois, today released its long-anticipated expansion plans into two major California markets, providing “best in class” roofing, solar energy systems and residential energy storage.


Phoenix Exteriors announced the March 1, 2021 opening of Phoenix Exteriors and Solar in Sacramento, California, to be followed by the April 1, 2021 opening in the Pleasanton, California area. Advertising campaigns are already underway promoting Grand Opening prices throughout Northern California. For a limited time during the Grand Opening, Phoenix Exteriors and Solar is offering high end Malarkey Roofs starting at $99 per month and tier one solar energy systems at $69 per month. Residential energy storage products will be offered some time in May 2021, along with Grand Opening promotional pricing.

Phoenix Exteriors has grown under the passionate leadership of Eric Stanis, Founder and CEO of Phoenix Exteriors. Stanis has been leading in the roofing and solar industry since 2007, building this highly rated home improvement company through the re-roof and siding of homes damaged by natural disasters throughout the Midwest and Texas. Phoenix Exteriors has been certified and approved to repair and replace storm damaged roofs and exteriors by all major insurance carriers and is a licensed insurance adjustor.

The new offices in California will also look to provide services to the home-building industry, offering new roofs, solar power systems and energy storage in early 2022. “We have been fortunate to recruit some of the best leadership in the country throughout our fourteen-year history. We have partnered with some of the best manufacturers of high-end roofing and solar energy product. California is ripe for a company like Phoenix to enter the market and offer the highest level of quality and service at very affordable price points. We are continuously evolving and innovating, intending to, and confident that we will, change the way roofing and solar is done on the West Coast!” says Stanis.

Phoenix will operate under Phoenix Exteriors and Solar LLC in California and is currently seeking qualified applicants for various positions at both locations. Phoenix Exteriors currently employs over one-hundred people nationwide and expects to double its employee base over the next eighteen months. “The jobs that we are offering will be in renewable energy and residential storage, which means they will be high paying jobs that will provide a fair and living wage to families throughout Northern California. Since these jobs are in renewables, each team member of the Phoenix family can feel good knowing that they are playing a role in mitigating climate change and improving the world for this generation and generations to come,” said Stanis.

Phoenix Exteriors operates offices in Chicago, Illinois, San Antonio and Austin, Texas and is a premier and certified installer of Malarkey roofing products, as well as over a dozen other manufacturers of roofing, siding, solar and residential home energy storage products. To learn more about the company, please visit Phoenix Exteriors at www.phoenixexteriors.com.


Contacts

Tricia Petersen - UP Advisors Group
(415) 819-8278

– Switching From Coal to Natural Gas to Reduce CO2 Emissions by Approx. 76,300t Over 10 Years –

OSAKA, Japan--(BUSINESS WIRE)--Sojitz Corporation (President: Masayoshi Fujimoto; “Sojitz”) and Osaka Gas Co., Ltd.’s (President: Masataka Fujiwara; “Osaka Gas”) joint venture company*¹ Sojitz Osaka Gas Energy Company Ltd. (General Director: Yoshiro Aoyama; “SOGEC”) has concluded a supply agreement on March 4th, 2021 with Acecook Co., Ltd.’s (“ACJ”) subsidiary, Acecook Vietnam Joint Stock Company (“ACV”), to provide natural gas to ACV’s food plants.


SOGEC is concentrating its efforts on fuel switching from coal to natural gas, and this project marks the company’s first time supplying natural gas to an individual business.*² This natural gas supply business will be a subsidized project*³ under Japan’s Joint Crediting Mechanism (JCM)*⁴ scheme. Additionally, this project will be undertaken in cooperation with the governments of Vietnam and Japan.

In partnership with Osaka and Ho Chi Minh City, ACV and SOGEC participated in a feasibility study*⁵ for reducing CO2 in food plants prior to replacing the coal-fired steam boilers at two of ACV’s plants with highly-efficient gas-fired steam boilers that use natural gas with the objective of improving the plants’ work environment and reducing CO2 emissions.

This business expects to reduce CO2 emissions by approximately 76,300t over a 10-year period. Under the JCM scheme, over half of this reduced CO2 amount will be issued as JCM carbon credits and delivered to the Japanese government, which will help Japan to realize its reduction targets for CO2 emissions.

Sojitz, Daigas Group (an Osaka Gas group brand), and SOGEC will continue to respond to the diverse business needs of its customers through the sale of environmentally-friendly natural gas, contributing to Vietnam’s sustainable development and to the realization of a low-carbon society.

*1: Equity ownership of Sojitz Osaka Gas Energy Company Ltd.: Sojitz Group 51%, Osaka Gas Singapore Pte. Ltd. 49%. (Osaka Gas Singapore Pte. Ltd. is a fully-owned subsidiary of Osaka Gas Co., Ltd.)

*2: In April 2020, SOGEC began supplying natural gas to Phu My 3 Specialized Industrial Park in Bà Rịa-Vũng Tàu Province in Southern Vietnam.

*3: Financing Programme for JCM Model Projects in FY2020
JCM Model Projects utilize leading low-carbon and decarbonization technologies to lower GHG emissions in developing countries through measurable, reportable, and verifiable (MRV) actions. In addition to reducing GHG emissions in developing countries, JCM projects aim to help Japan and its partner countries achieve their GHG emission reduction targets. The Financing Progarmme for JCM Model Projects will fund up to half of the initial investment costs for advanced low-carbon and decarbonization technologies.
The Global Environment Centre Foundation (GEC) has been commissioned by the Ministry of the Environment of Japan (MOEJ) to function as a secretariat to manage JCM-related subsidy programs, which are open to private enterprises in Japan.
ACJ, ACV and SOGEC received financing from MOEJ under the Financing Programme for JCM Model Projects in FY2020 on September 28th, 2020.

*4: Joint Crediting Mechanism (JCM): In this bilateral mechanism, Japan provides developing countries with leading low-carbon technologies and products, systems, services, and infrastructures, which contribute to sustainable development in these countries by reducing greenhouse gas emissions. With JCM projects, both countries are able to benefit from reduced emissions. Japan’s efforts to reduce greenhouse gas emissions can be evaluated quantitatively through JCMs, which allow Japan to apply JCM credits to meet its emission reduction targets.

*5: As part of the City-to-city Collaboration Programme, this feasibility study was commissioned by the Ministry of the Environment of Japan (MOEJ) to support effective and efficient initiatives for building low-carbon and decarbonized society models, which are undertaken by Japanese municipalities with expertise on constructing these models and partner cities outside Japan. Osaka and Ho Chi Minh City jointly took part in this City-to-City Cooperation Project in which ACV and SOGEC also participated.

(Attachment)

1. Project Overview

Equipment to be Installed

Steam Supply Capacity

7,000 kg/h per unit (converted evaporation amount)

Installed Units

13 units (2 plants)

Supplied Fuel

Natural gas and LPG-air

Estimated Reduction of CO2

7,631t- CO2 /year

Start Date

July 2021 (planned)

Location and Exterior (Façade) of Installation Sites

- ACV Hung Yen plant
Nhu Quynh Town, Van Lam District, Hung Yen Province

- ACV Binh Duong plant
Quarter 1B, An Phu Ward, Thuan An Town, Binh Duong Province

2. Participating Companies

[Company Overview – Sojitz Osaka Gas Energy Company Ltd.]

Established

October 2019

Location

Ba Ria - Vung Tau Province, Socialist Republic of Vietnam

Representative Director

Yoshiro Aoyama

Ownership

Sojitz Group - 51%

(Sojitz Corporation - 26%, Sojitz Vietnam Co., Ltd. - 25%)

Osaka Gas Singapore Pte. Ltd. - 49%

Main Business

Supply of natural gas to industrial users, energy services, and energy-related engineer and consulting services in Vietnam

[Company Overview – Sojitz Corporation]

Established

April 2003

Location

1-1, Uchisaiwaicho 2-chome, Chiyoda-ku, Tokyo

Representative Director

Masayoshi Fujimoto

Main Business

General trading company (trading and business investment in Japan and overseas)

[Company Overview – Osaka Gas Co., Ltd.]

Established

April 1897

Location

4-1-2 Hiranomachi, Chuo-ku, Osaka

Representative Director

Masataka Fujiwara

Main Business

Gas production, supply, and sales; power generation, supply, and sales

3. Related News Releases

Sojitz Corporation: “Sojitz and Osaka Gas Establish Natural Gas Supply Company in Vietnam” (Jun. 24th, 2019)
https://www.sojitz.com/en/news/2019/06/20190624.php

Osaka Gas Co., Ltd.: “Establishing a Natural Gas Supply Company in Vietnam” (Jun. 24th, 2019)
https://www.osakagas.co.jp/en/whatsnew/__icsFiles/afieldfile/2019/06/24/190624_2_1.pdf


Contacts

Press Inquiries:
Osaka Gas Co., Ltd.
International Business Strategy Team
Strategy & Planning Dept.
Energy Solution Business Unit
Tel: +81-(0)6-6205-3546

Sojitz Corporation
Public Relations Dept.
Tel: +81-(0)3-6871-3404

LIBERTY LAKE, Wash.--(BUSINESS WIRE)--Itron, Inc. (NASDAQ: ITRI) (the “Company”), which is innovating the way utilities and cities manage energy and water, today announced the pricing of its underwritten public offering of 3,888,889 shares of common stock at a price to the public of $90.00 per share. The underwriters will also have a 30-day option to purchase up to an additional 583,333 shares. The offering is expected to close on or about March 12, 2021, subject to customary closing conditions.


The Company intends to use the net proceeds from the offering, together with cash on hand, to repay outstanding term loan borrowings under its credit facility that was initially entered into on January 5, 2018, and to pay all fees and expenses related to the offering and such repayment.

The Company also announced by separate press release that it has priced its previously announced private offering to eligible purchasers of $400 million aggregate principal amount of 0% convertible senior notes due 2026. The initial purchasers of the convertible notes have a 13-day option to purchase up to an additional $60 million aggregate principal amount of convertible notes. The offering of convertible notes is expected to close on or about March 12, 2021, subject to customary closing conditions. The closing of the offering of shares is not contingent upon the closing of the offering of convertible notes (or vice versa).

J.P. Morgan Securities LLC is acting as lead book-running manager for the offering. Wells Fargo Securities is acting as book-running manager for the offering.

A shelf registration statement relating to these securities was declared effective by the Securities and Exchange Commission (the “SEC”) on March 8, 2021. The offering is being made only by means of a prospectus. Copies of the prospectus relating to the offering, when available, may be obtained from (1) J.P. Morgan Securities LLC, c/o Broadridge Financial Solutions, 1155 Long Island Avenue, Edgewood, New York 11717, via telephone at 1-866-803-9204 or via email at This email address is being protected from spambots. You need JavaScript enabled to view it. and (2) Wells Fargo Securities, LLC, Attention: Equity Syndicate Department, 500 West 33rd Street, New York, New York 10001, via telephone 1-800-326-5897, or via email at This email address is being protected from spambots. You need JavaScript enabled to view it..

This press release does not constitute an offer to sell or a solicitation of an offer to buy shares of common stock and shall not constitute an offer, solicitation or sale in any jurisdiction in which such an offer, solicitation or sale would be unlawful prior to the registration and qualification under the securities laws of such state or jurisdiction.

About Itron
Itron® enables utilities and cities to safely, securely and reliably deliver critical infrastructure services to communities in more than 100 countries. Our portfolio of smart networks, software, services, meters and sensors helps our customers better manage electricity, gas and water resources for the people they serve. By working with our customers to ensure their success, we help improve the quality of life, ensure the safety and promote the well-being of millions of people around the globe. Itron is dedicated to creating a more resourceful world.

Itron® is a registered trademark of Itron, Inc. All third-party trademarks are property of their respective owners and any usage herein does not suggest or imply any relationship between Itron and the third party unless expressly stated.

Cautionary Note Regarding Forward Looking Statements
This release contains, and our officers and representatives may from time to time make, "forward-looking statements" within the meaning of the safe harbor provisions of the U.S. Private Securities Litigation Reform Act of 1995. Forward-looking statements are neither historical factors nor assurances of future performance. These statements are based on our expectations about, among others, revenues, operations, financial performance, earnings, liquidity, earnings per share, cash flows and restructuring activities including headcount reductions and other cost savings initiatives. This document reflects our current strategy, plans and expectations and is based on information currently available as of the date of this release. When we use words such as "expect," "intend," "anticipate," "believe," "plan," "goal," "seek," "project," "estimate," "future," "strategy," "objective," "may," "likely," "should," "will," "will continue," and similar expressions, including related to future periods, they are intended to identify forward-looking statements. Forward-looking statements rely on a number of assumptions and estimates. Although we believe the estimates and assumptions upon which these forward-looking statements are based are reasonable, any of these estimates or assumptions could prove to be inaccurate and the forward-looking statements based on these estimates and assumptions could be incorrect. Our operations involve risks and uncertainties, many of which are outside our control, and any one of which, or a combination of which, could materially affect our results of operations and whether the forward-looking statements ultimately prove to be correct. Actual results and trends in the future may differ materially from those suggested or implied by the forward-looking statements depending on a variety of factors. Therefore, you should not rely on any of these forward-looking statements. Some of the factors that we believe could affect our results include our ability to execute on our restructuring plan, our ability to achieve estimated cost savings, the rate and timing of customer demand for our products, rescheduling of current customer orders, changes in estimated liabilities for product warranties, adverse impacts of litigation, changes in laws and regulations, our dependence on new product development and intellectual property, future acquisitions, changes in estimates for stock-based and bonus compensation, increasing volatility in foreign exchange rates, international business risks, uncertainties caused by adverse economic conditions, including, without limitation those resulting from extraordinary events or circumstances such as the COVID-19 pandemic and other factors that are more fully described in Part I, Item 1A: Risk Factors included in our latest Annual Report on Form 10-K filed with the SEC. Itron undertakes no obligation to update or revise any information in this press release.

The impact caused by the ongoing COVID-19 pandemic includes uncertainty as to the duration, spread, severity, and any resurgence of the COVID-19 pandemic including other factors contributing to infection rates, such as reinfection or mutation of the virus, the effectiveness or widespread availability and application of any vaccine, the duration and scope of related government orders and restrictions, impact on overall demand, impact on our customers’ businesses and workforce levels, disruptions of our business and operations, including the impact on our employees, limitations on, or closures of, our facilities, or the business and operations of our customers or suppliers. Our estimates and statements regarding the impact of COVID-19 are made in good faith to provide insight to our current and future operating and financial environment and any of these may materially change due to factors outside our control. For more information on risks associated with the COVID-19 pandemic, please see Itron’s updated risk in Part I, Item 1A: Risk Factors of our latest Form 10-K filed with the SEC.


Contacts

Itron, Inc.
Kenneth P. Gianella
Vice President, Investor Relations
(669) 770-4643

Offshore Source Logo

Offshore Source keeps you updated with relevant information concerning the Offshore Energy Sector.

Any views or opinions represented on this website belong solely to the author and do not represent those of the people, institutions or organizations that Offshore Source or collaborators may or may not have been associated with in a professional or personal capacity, unless explicitly stated.

Corporate Offices

Technology Systems Corporation
8502 SW Kansas Ave
Stuart, FL 34997

info@tscpublishing.com