Business Wire News

DULUTH, Minn.--(BUSINESS WIRE)--The ALLETE, Inc. (NYSE:ALE) board of directors has declared a quarterly dividend of 65 cents per share of common stock.


On an annual basis, the dividend is equivalent to $2.60 per share, unchanged from the previous quarter.

The regular quarterly dividend is payable Dec. 1 to common stock shareholders of record at the close of business Nov. 15, 2022.

ALLETE, Inc. is an energy company headquartered in Duluth, Minnesota. In addition to its electric utilities, Minnesota Power and Superior Water, Light and Power of Wisconsin, ALLETE owns ALLETE Clean Energy, based in Duluth; BNI Energy in Bismarck, ND; New Energy Equity, headquartered in Annapolis, MD; and has an 8% equity interest in the American Transmission Co. More information about ALLETE is available at www.allete.com. ALE-CORP

The statements contained in this release and statements that ALLETE may make orally in connection with this release that are not historical facts, are forward-looking statements. These forward-looking statements involve risks and uncertainties and investors are directed to the risks discussed in documents filed by ALLETE with the Securities and Exchange Commission.


Contacts

Investor Contact:
Vince Meyer
218-723-3952
This email address is being protected from spambots. You need JavaScript enabled to view it.

In collaboration with leading environmental groups and public/private stakeholders, the 52-page report provides blueprint for decarbonization of the maritime transportation and goods movement in LA.

LOS ANGELES--(BUSINESS WIRE)--AltaSea at the Port of Los Angeles released a 52-page white paper that illustrates how Southern California is exceptionally well situated to jumpstart an economically self-sustaining green hydrogen economy. AltaSea led the research and drafting of the white paper with a number of partners, including 7th Generation Advisors, Accenture, Energy Independence Now, and Momentum.


The report shows that California has the vast majority of hydrogen refueling stations in the United States, 71% of total number of hydrogen fuel cell electric vehicles (FCEVs) in the United States, and an abundance of hard-to-electrify sectors that would benefit from hydrogen-electric technologies. These strengths, the report said, are backed by one of the globe’s strongest economies. In 2021, California’s gross domestic product (GDP) was $3.36 trillion, representing 14.6% of the total U.S. economy. If it were a country, California would have the fifth largest economy in the world.

“Both California as a whole and the Southern California region in particular are leading efforts to decarbonize the state’s modern economy, while creating new jobs, advancing equity, and tackling some of the state’s most pressing environmental challenges, including drought, wildfires, extreme heat, poor air quality, and pollution,” said the report, which can be downloaded at: https://www.socalh2.org/vision.

“Our research underscores the many opportunities to decarbonize maritime transportation and goods movement, especially in ports, using hydrogen,” said AltaSea President & CEO Terry Tamminen, architect of California’s pioneering Hydrogen Highway. “Clean renewable hydrogen for ships and heavy-duty vehicles means cleaner air and reduced carbon pollution.”

As a part of this larger, statewide effort, AltaSea has been engaged with many organizations in Southern California to form the Southern California Green Hydrogen Cluster. Since early 2022, this informal group of stakeholders has met regularly to discuss the much-anticipated DOE Regional Clean Hydrogen Hubs funding solicitation and how the region can best support a statewide application to this program.

“We are just scratching the surface of how an investment in the environmentally and economically sustainable green hydrogen market can benefit our planet,” Tamminen said. “The research we have conducted and presented in this white paper makes it clear that a renewable hydrogen hub in California would accelerate the transition to a carbon-neutral economy and would create high-quality jobs, improve air quality and drive down costs.”

AltaSea expressed its appreciation to the U.S. Department of Energy (DOE) for its leadership, guidance, and funding of the statewide California Renewable Hydrogen Hub under development by the California Governor’s Office of Business and Economic Development—GO-Biz.

About AltaSea at the Port of Los Angeles

AltaSea at the Port of Los Angeles is dedicated to accelerating scientific collaboration, advancing an emerging blue economy through business innovation and job creation, and inspiring the next generation, all for a more sustainable, just, and equitable world.

For more information on AltaSea, please visit: https://altasea.org


Contacts

Jacob Scott
This email address is being protected from spambots. You need JavaScript enabled to view it.
412-445-7719

DALLAS--(BUSINESS WIRE)--Spring Valley Acquisition Corp. II (NASDAQ: SVIIU) (the “Company”) announced that, commencing October 28, 2022, holders of the units sold in the Company’s initial public offering of 23,000,000 units, completed on October 13, 2022, may elect to separately trade the Class A ordinary shares, rights and warrants included in the units. Any units not separated will continue to trade on the Nasdaq Capital Market (the “Nasdaq”) under the symbol “SVIIU,” and the separated Class A ordinary shares, rights and warrants are expected to trade on the Nasdaq under the symbols “SVII,” “SVIIR” and “SVIIW,” respectively. No fractional warrants will be issued upon separation of the units and only whole warrants will trade. Holders of units will need to have their brokers contact Continental Stock Transfer & Trust Company, the Company’s transfer agent, in order to separate the units into Class A ordinary shares, rights and warrants.


The units were initially offered by the Company in an underwritten offering. Citigroup Global Markets, Inc. and Guggenheim Securities, LLC acted as joint book-running managers of the offering. A registration statement relating to the units and the underlying securities was declared effective by the Securities and Exchange Commission (the “SEC”) on October 12, 2022.

This press release shall not constitute an offer to sell or the solicitation of an offer to buy the securities of the Company, nor shall there be any sale of these securities in any state or jurisdiction in which such offer, solicitation or sale would be unlawful prior to registration or qualification under the securities laws of any such state or jurisdiction.

About Spring Valley Acquisition Corp. II

Spring Valley Acquisition Corp. II is a blank check company formed for the purpose of entering into a merger, share exchange, asset acquisition, share purchase, reorganization or similar business combination with one or more businesses or entities. While the Company may pursue an initial business combination target in any business or industry, the Company is targeting companies in the sustainability industry, including renewable energy, resource optimization, environmental services, and grid infrastructure, which complement the backgrounds of the Company’s management team. The Company is led by its Chief Executive Officer and Chairman, Chris Sorrells, and Chief Financial Officer, Rob Kaplan. The Company’s sponsor is supported by Pearl Energy Investment Management, LLC, a Dallas, Texas-based investment firm that focuses on partnering with experienced management teams to invest in the North American energy and sustainability sectors. Pearl typically targets opportunities requiring $25 million to $150 million of equity capital.

Forward-Looking Statements

This press release may include “forward-looking statements” within the meaning of Section 27A of the Securities Act of 1933, as amended, and Section 21E of the Securities Exchange Act of 1934, as amended. All statements other than statements of historical fact included in this press release are forward-looking statements. When used in this press release, words such as “anticipate,” “believe,” “estimate,” “expect,” “intend” and similar expressions identify forward-looking statements. Forward-looking statements are subject to numerous conditions, many of which are beyond the control of the Company, including those set forth in the Risk Factors section of the Company’s registration statement and prospectus relating to the Company’s initial public offering filed with the SEC. The Company undertakes no obligation to update these statements for revisions or changes after the date of this release, except as required by law.


Contacts

Spring Valley Acquisition Corp. II
www.sv-ac.com
Robert Kaplan
This email address is being protected from spambots. You need JavaScript enabled to view it.

DUBLIN--(BUSINESS WIRE)--The "Deep Sea, Coastal, And Great Lakes Global Market Report 2022: By Application" report has been added to ResearchAndMarkets.com's offering.


This report provides strategists, marketers and senior management with the critical information they need to assess the global deep sea, coastal, and great lakes market as it emerges from the COVID-19 shut down.

The global deep sea, coastal, and great lakes transportation market is expected to grow from $490.34 billion in 2021 to $518.76 billion in 2022 at a compound annual growth rate (CAGR) of 5.8%. The market is expected to grow to $628.88 billion in 2026 at a compound annual growth rate (CAGR) of 4.9%.

Companies Mentioned

  • A.P. Moller-Maersk A/S
  • China Ocean Shipping Company Limited
  • Cargill Incorporated
  • CMA CGM S.A.
  • Hapag-Lloyd AG
  • Evergreen Marine corp.
  • K-Line
  • Hyundai Merchant Marine Co. ltd.
  • Nippon Yusen
  • Kuehne + Nagel International AG

Reasons to Purchase

  • Gain a truly global perspective with the most comprehensive report available on this market covering 50+ geographies
  • Understand how the market is being affected by the coronavirus and how it is likely to emerge and grow as the impact of the virus abates
  • Create regional and country strategies on the basis of local data and analysis
  • Identify growth segments for investment
  • Outperform competitors using forecast data and the drivers and trends shaping the market
  • Understand customers based on the latest market research findings
  • Benchmark performance against key competitors
  • Utilize the relationships between key data sets for superior strategizing
  • Suitable for supporting your internal and external presentations with reliable high quality data and analysis

The deep sea, coastal, and great lakes transportation market consists of sales of the deep sea, coastal, and great lakes transportation services and related goods by entities (organizations, sole traders, and partnerships) that provide deep sea, coastal, and great lakes transportation of passengers and cargo using watercraft, such as ships, barges, and boats.

The main types in the deep sea, coastal, and great lakes transportation market are deep-sea transport and coastal and great lakes transport. Deep-sea transport refers to the maritime transport of goods on intercontinental routes, crossing oceans as opposed to short sea shipping through relatively short distances. The market is also segmented by application into onshore and offshore.

Asia-Pacific was the largest region in the deep sea, coastal, and great lakes transportation market in 2021. Western Europe was the second largest region in the deep sea, coastal, and great lakes transportation market. The regions covered in this report are Asia-Pacific, Western Europe, Eastern Europe, North America, South America, Middle East, and Africa.

Water transportation service companies are increasingly using sensor technologies to enable monitoring of remote locations of ships. A sensor is a device that detects and responds to some type of input from the physical environment. The specific input could be light, heat, motion, moisture, pressure, or any one of several other environmental phenomena present in the ship. Sensors in remote locations of ships collect data autonomously and relay the data to the control room in real-time. The data captured by the sensor allows ship owners to improve the overall maintenance cycle of visits, including condition monitoring and condition-based monitoring. For instance, NoraSens and Silicon Radar are some of the company's manufacturing sensors for ships.

The countries covered in the deep sea, coastal, and great lakes transportation market report are Argentina, Australia, Austria, Belgium, Brazil, Canada, Chile, China, Colombia, Czech Republic, Denmark, Egypt, Finland, France, Germany, Hong Kong, India, Indonesia, Ireland, Israel, Italy, Japan, Malaysia, Mexico, Netherlands, New Zealand, Nigeria, Norway, Peru, Philippines, Poland, Portugal, Romania, Russia, Saudi Arabia, Singapore, South Africa, South Korea, Spain, Sweden, Switzerland, Thailand, Turkey, UAE, UK, USA, Venezuela, and Vietnam.

For more information about this report visit https://www.researchandmarkets.com/r/38dgtg


Contacts

ResearchAndMarkets.com
Laura Wood, Senior Press Manager
This email address is being protected from spambots. You need JavaScript enabled to view it.
For E.S.T Office Hours Call 1-917-300-0470
For U.S./ CAN Toll Free Call 1-800-526-8630
For GMT Office Hours Call +353-1-416-8900

MANSFIELD, Ohio--(BUSINESS WIRE)--#dividend--The Board of Directors of The Gorman-Rupp Company (NYSE: GRC) has declared a quarterly cash dividend of $0.175 per share on the common shares of the Company, payable December 9, 2022, to shareholders of record November 15, 2022. The cash dividend will represent a 2.9% increase over the $0.17 dividend per share paid in the previous quarter.


This action will mark the 291st consecutive quarterly dividend paid by The Gorman-Rupp Company and the 50th consecutive year of increased dividends to its shareholders, which positions Gorman-Rupp in the top 50 of all U.S. public companies with respect to number of years of increased dividend payments.

Scott A. King, President and CEO commented, “Gorman-Rupp has a long history of dividend payments and we are extremely proud to celebrate reaching the significant milestone of our 50th consecutive year of increased dividends. The current increase reflects our commitment to returning value to our shareholders, as well as our confidence in the financial strength and long-term outlook for our Company.”

About The Gorman-Rupp Company

Founded in 1933, The Gorman-Rupp Company is a leading designer, manufacturer and international marketer of pumps and pump systems for use in diverse water, wastewater, construction, dewatering, industrial, petroleum, original equipment, agriculture, fire suppression, heating, ventilating and air conditioning (HVAC), military and other liquid-handling applications.

Forward-Looking Statements

In connection with the “safe harbor” provisions of the Private Securities Litigation Reform Act of 1995, The Gorman-Rupp Company provides the following cautionary statement: This news release contains various forward-looking statements based on assumptions concerning The Gorman-Rupp Company’s operations, future results and prospects. These forward-looking statements are based on current expectations about important economic, political, and technological factors, among others, and are subject to risks and uncertainties, which could cause the actual results or events to differ materially from those set forth in or implied by the forward-looking statements and related assumptions. Such uncertainties include, but are not limited to, our estimates of future earnings and cash flows, general economic conditions and supply chain conditions and any related impact on costs and availability of materials, and uncertainties related to our acquisition of the assets of Fill-Rite, including but not limited to integration of the acquired business in a timely and cost effective manner, retention of supplier and customer relationships and key employees, the ability to achieve synergies and cost savings in the amounts and within the time frames currently anticipated and the ability to service and repay indebtedness incurred in connection with the transaction. Other factors include, but are not limited to: company specific risk factors including (1) loss of key personnel; (2) intellectual property security; (3) acquisition performance and integration; (4) impairment in the value of intangible assets, including goodwill; (5) defined benefit pension plan settlement expense; and (6) family ownership of common equity; and general risk factors including (7) continuation of the current and projected future business environment, including the impact of inflation and other cost pressures, the duration and scope of the COVID-19 pandemic, the impact of the pandemic and actions taken in response to the pandemic; (8) highly competitive markets; (9) availability and costs of raw materials and labor; (10) cyber security threats; (11) compliance with, and costs related to, a variety of import and export laws and regulations; (12) environmental compliance costs and liabilities; (13) exposure to fluctuations in foreign currency exchange rates; (14) conditions in foreign countries in which The Gorman-Rupp Company conducts business; (15) changes in our tax rates and exposure to additional income tax liabilities; and (16) risks described from time to time in our reports filed with the Securities and Exchange Commission. Except to the extent required by law, we do not undertake and specifically decline any obligation to review or update any forward-looking statements or to publicly announce the results of any revisions to any of such statements to reflect future events or developments or otherwise.


Contacts

Brigette A. Burnell
Corporate Secretary
The Gorman-Rupp Company
Telephone (419) 755-1246
NYSE: GRC

For additional information, contact James C. Kerr, Chief Financial Officer, Telephone (419) 755-1548.

ATLANTIC CITY, N.J.--(BUSINESS WIRE)--Atlantic Shores Offshore Wind Project 1, LLC (Atlantic Shores Project 1), a wholly owned subsidiary of Atlantic Shores Offshore Wind, LLC (Atlantic Shores), a 50:50 partnership between Shell New Energies US LLC and EDF-RE Offshore Development, LLC, announced it has selected Ramboll as the design and structural engineering firm for the turbine foundations on its 1.5 GW offshore wind project.


Located approximately 10-20 miles off the coast of Atlantic City, New Jersey, the project will generate enough clean energy to power more than 700,000 homes and bring $848 million in guaranteed local economic benefits to the state. This is the largest single project in New Jersey and third largest in the United States. Atlantic Shores is also making significant economic development investments, including a comprehensive job training program and an innovative 10 MW green hydrogen pilot.

Ramboll is a global leader in the design of offshore wind turbine foundations and will contribute its decades of experience and knowledge in the offshore wind industry to the design of wind turbine foundations for Atlantic Shores Project 1.

“Atlantic Shores Project 1 is thrilled to partner with Ramboll on our foundation design and helping us set industry benchmarks for safety, reliability, and efficiency,” said Rain Byars, Technical & Delivery Director for Atlantic Shores Offshore Wind. “Ramboll is the right choice to perform this critical work as Atlantic Shores literally lays the foundation for New Jersey’s clean energy transition. With our recent announcement of Vestas as preferred turbine supplier, adding the expertise and experience of Ramboll to our 1.5 GW offshore wind project is yet another vote of confidence in Atlantic Shores Project 1 and Atlantic Shores’ entire 5+ GW portfolio.”

Ramboll will provide a comprehensive design service to be led by a group of experts across the United States and Europe. This work will accelerate the deployment of offshore wind resources and support New Jersey’s thriving clean energy economy by creating jobs and local employment opportunities over the life of the project.

“We are proud to partner with Atlantic Shores Offshore Wind on the design of its turbine foundations and support New Jersey in reaching its offshore wind development targets,” said Tim Fischer, Global Senior Director of Wind for Ramboll. “With a local presence of more than 2,000 staff across the US and from our recently expanded offices in Princeton, Ramboll is well-positioned to contribute its industry knowledge to the local clean tech sector and help New Jersey achieve its ambitious climate goals.”

About Atlantic Shores Offshore Wind:

Atlantic Shores Offshore Wind is a 50:50 joint venture between EDF Renewables and Shell New Energies US LLC. Both companies come with decades of experience developing onshore and offshore projects across the globe. Atlantic Shores Offshore Wind is composed of over 100 experts dedicated to delivering its 5+GW portfolio, strategically positioned to meet the growing demands of multiple East Coast Markets.

Atlantic Shores Offshore Wind is developing a portfolio of wind farms off the coast of New Jersey and New York that will be a major source of clean, affordable energy for the state and region; this includes a 1.5 GW project off the coast of Atlantic City that will power 700,000 homes by 2027 and 2028. Atlantic Shores has three additional projects that will provide power to hundreds of thousands more.

We invite you to learn more about Atlantic Shores Offshore Wind by visiting our website at www.atlanticsshoreswind.com and following us on our social media channels:

www.linkedin.com/company/atlantic-shores-wind
www.facebook.com/atlshoreswind
www.instagram.com/atlshoreswind
www.twitter.com/ATLShoresWind

About Ramboll:

Ramboll is a global architecture, engineering and consultancy company founded in Denmark in 1945. Our 16,500 experts create sustainable solutions across Buildings, Transport, Energy, Environment & Health, Water, Management Consulting and Architecture & Landscape. Across the world, Ramboll combines local experience with a global knowledge base to create sustainable cities and societies. We combine insights with the power to drive positive change for our clients, in the form of ideas that can be realized and implemented. For more information, please visit https://ramboll.com/


Contacts

Terence Kelly
Head of External Affairs
Atlantic Shores Offshore Wind
Mail: This email address is being protected from spambots. You need JavaScript enabled to view it.
Tel: +1 (347) 834-3957

Phil Chinitz
External Affairs Consultant | PR
Atlantic Shores Offshore Wind
Mail: This email address is being protected from spambots. You need JavaScript enabled to view it.
Tel: +1 (516) 659-9369

Morten Peick
Senior Group Director, Clients Communication & Marketing
Ramboll
Atlantic Shores Offshore Wind
Mail: This email address is being protected from spambots. You need JavaScript enabled to view it.
Tel: +45 5161 6065

  • Critical Metals will own European Lithium’s Wolfsberg Lithium Project located in Wolfsberg, Austria, 270 kilometers south of Vienna, which is expected to be the first licensed lithium mine in Europe
  • Based on pre-feasibility study, mine expected to supply approximately 70,000 metric tons of lithium concentrate annually starting in 2025, enough material to power approximately 200,000 EVs per year; results of definitive feasibility study expected in early 2023
  • Key strategic customer offtake MOU with global automotive powerhouse, BMW AG, expected to create one of the largest ever direct OEM pre-pays in the lithium mining industry
  • Project has completed pilot test work through independent consultants, which has demonstrated its expected ability to supply lithium concentrate at commercial scale
  • Proceeds of the transaction, including the non-redeemed portion of the approximately $159 million1 cash-in-trust of Sizzle Acquisition Corp., are expected to be used for construction and commissioning of the Project


PERTH, Australia & WASHINGTON--(BUSINESS WIRE)--Please replace the release dated October 24, 2022, with the following corrected version. All instances of "10,500 metric tons of lithium concentrate" should instead read "70,000 metric tons of lithium concentrate."

The updated release reads:

CRITICAL METALS, EUROPE’S FIRST FULLY LICENSED LITHIUM MINE AGREES TO GO PUBLIC ON THE NASDAQ THROUGH A BUSINESS COMBINATION WITH SIZZLE ACQUISITION CORP

  • Critical Metals will own European Lithium’s Wolfsberg Lithium Project located in Wolfsberg, Austria, 270 kilometers south of Vienna, which is expected to be the first licensed lithium mine in Europe
  • Based on pre-feasibility study, mine expected to supply approximately 70,000 metric tons of lithium concentrate annually starting in 2025, enough material to power approximately 200,000 EVs per year; results of definitive feasibility study expected in early 2023
  • Key strategic customer offtake MOU with global automotive powerhouse, BMW AG, expected to create one of the largest ever direct OEM pre-pays in the lithium mining industry
  • Project has completed pilot test work through independent consultants, which has demonstrated its expected ability to supply lithium concentrate at commercial scale
  • Proceeds of the transaction, including the non-redeemed portion of the approximately $159 million1 cash-in-trust of Sizzle Acquisition Corp., are expected to be used for construction and commissioning of the Project

European Lithium AT (Investments) Limited, a wholly owned subsidiary of European Lithium Ltd (ASX: EUR) (“European Lithium”), and Sizzle Acquisition Corp, (Nasdaq: SZZL) (“Sizzle”), a publicly traded special purpose acquisition company, today announced that they have entered into a definitive agreement for a business combination that will result in the formation of Critical Metals Corp. (“Critical Metals”), which is expected to be a leading lithium mining company. Upon closing, subject to approval by European Lithium and Sizzle stockholders and other customary requirements, Critical Metals intends to be listed on Nasdaq under the symbol “CRML,” which is expected to occur in the first half of 2023.

Upon closing of the business combination, Critical Metals will own European Lithium’s Wolfsberg Lithium Project (the “Project”), which is currently owned by European Lithium’s wholly owned subsidiary, European Lithium AT (Investments) Limited, as well as a 20% interest in additional Austrian projects currently held by European Lithium. European Lithium will be the largest shareholder of Critical Metals and is expected to continue to trade on the Australian Securities Exchange (“ASX”). The board of Critical Metals is expected to comprise a total of 5 members, 4 of whom will be nominees of European Lithium and 1 of whom will be a nominee of Sizzle. Critical Metals will be led by Executive Chairman, Tony Sage, and Chief Executive Officer, Dietrich Wanke.

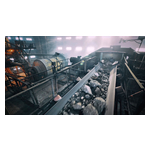
In order to support the rapidly growing EV supply chain in Europe, the Project is expected to become the region’s first major source of lithium concentrate, filling a critical gap in the European EV battery supply chain. Located in Wolfsberg, Austria, in the heart of this supply chain, the Project is expected to be uniquely positioned to capitalize on three key competitive differentiators:

- The First Licensed Lithium Mine in Europe –the Project holds an exclusive license to repurpose a former Austrian government constructed lithium mine that contains a substantial amount of lithium, minimizing the overall environmental impact of the discovery and processes.

- Key Strategic Offtake MOU – European Lithium has entered into a MOU for a key customer arrangement with BMW AG, which upon execution of definitive agreements would create one of the largest direct pre-pays from an OEM in Europe in the lithium mining industry of $15 million.

- Definitive Feasibility Study (DFS) Expected in Early 2023 – the Project is aiming to supply lithium concentrate at commercial scale and be economically viable, as per its completed pre-feasibility study (PFS), with the results of DRA Global’s final definitive feasibility study (DFS) expected in Q1 2023.

Backed by considerable legislative support worldwide for cleaner transportation, automakers and battery manufacturers continue to ramp up production of electric vehicles (EVs) to meet overwhelming consumer demand, creating a critical need for additional sources of battery-grade lithium – an essential material for EV batteries.

Through its pilot plant constructed by independent consultants Dorfner Anzaplan in Austria, European Lithium previously demonstrated the Project’s expected ability to supply lithium concentrate through the processing of spodumene. The results from the pilot plant demonstrated that the Project can supply lithium at 99.6% of lithium carbonate grade.

Management Commentary

We are enthusiastic to partner with the Sizzle team to become a publicly traded company on Nasdaq and are thrilled to have Carolyn Trabuco, Sizzle’s lead independent director, join our board,” said Critical Metals Executive Chairman, Tony Sage. “The need for additional battery-grade lithium in Europe will only continue to accelerate as demand for EVs continues to outstrip supply. The Project is poised to become the first major source of battery-grade lithium in Europe, the world’s leading EV market, capable of supporting the production of approximately 200,000 EVs per year. The funds raised though this transaction will provide us with the resources anticipated to be required to advance construction and commissioning of the Project. With the capital raised, in addition to the increased access to the public capital markets by listing on Nasdaq by means of the business combination, we believe we will be able to achieve our commercial goals by 2025.”

Critical Metals is poised to capitalize on significant macroeconomic tailwinds as Europe’s first source of battery-grade lithium,” commented Steve Salis, CEO of Sizzle. “Backed by accelerating demand for establishing additional capacity for lithium supply in Europe, strategic global partners, and a seasoned management team with deep expertise in the mining space, we believe that the Project provides a compelling and unique opportunity for U.S. investors to have exposure to the European EV supply chain.”

The team at Critical Metals has made significant progress advancing Europe’s first licensed lithium mine and is well positioned to be the largest supplier of battery-grade lithium in the region,” added Vice Chairman of Sizzle, Jamie Karson. “We are pleased to partner with Tony, Dietrich and the rest of the excellent management team as Critical Metals becomes a publicly traded company in the U.S. As reinforced by Critical Metals’ expected strategic arrangement with BMW AG, we believe the Project will play a key role in further accelerating EV adoption in Europe.”

Key Investment Highlights:

  • Large and Growing Demand for Lithium-ion Batteries – while lacking domestic supply sources for battery raw materials, Europe has proven to be an early adopter of EVs, and a global leader in the EV revolution. The Project is expected to provide Europe with the supply it does not currently have.
  • Europe’s First Licensed Lithium Spodumene Mine – mine initially built by the Austrian government successfully demonstrated its capability to supply high purity lithium (99.6% lithium carbonate equivalent) at pilot plant.
  • Economic Viability with PFS Completed and DFS Underway – Project is expected to be well positioned to supply approximately 70,000 metric tons of lithium concentrate per year starting in 2025 from Zone 1, which can be further refined into approximately 10,500 metric tons of battery-grade lithium hydroxide. Positive drilling results confirm Zone 2, an exploration target, could mirror Zone 1, doubling the Project’s resource.
  • Leverages Existing Infrastructure – existing exploration mine in central Europe, 270km SW of Vienna, close to Graz and Klagenfurt airport, as well as railway and highway access, which is expected to reduce capital requirements to complete development of the Project.
  • Leading Domestic Offtake MOU with BMW AG – key strategic off-take arrangement with BMW AG to supply 100% of the Project’s Zone 1 lithium product, including a $15 million pre-payment; binding agreement expected to be finalized in Q4 2022.
  • Advanced Project Mine Life – Project expected to supply battery-grade lithium for more than 20 years, establishing a critical fully integrated lithium supplier for the European EV industry.

Transaction Overview

The Proposed Transaction values the combined entity at an implied pro forma enterprise value of approximately $838 million, and at an implied pro forma market capitalization of approximately $972 million. The implied pre-money equity value is $750 million. The transaction is expected to provide approximately $159 million in capital before transaction expenses and the impact of redemptions by the public stockholders of Sizzle. European Lithium will roll 100% of its existing equity in European Lithium AT (Investments) Limited into the combined entity, retaining approximately 80% of the combined company’s pro forma equity before the impact of redemptions or any additional capital raised.

The Boards of Directors of each of European Lithium and Sizzle have unanimously approved the transaction. The transaction will require the approval of European Lithium and Sizzle stockholders and is subject to other customary closing conditions. It is currently expected that the transaction will close in the first half of 2023.

Additional information about the proposed transaction consisting of, among other things, a newly released video of the Project will be available on the Critical Metals website at https://criticalmetalscorp.com/.

Advisors

Jett Capital Advisors, LLC is acting as exclusive financial advisor to European Lithium; White & Case LLP is acting as U.S. legal advisor to European Lithium. Cohen & Company Capital Markets, a division of J.V.B. Financial Group, LLC, is acting as exclusive financial advisor and exclusive capital markets advisor to Sizzle; Ellenoff, Grossman & Schole LLP is acting as legal advisor to Sizzle.

About Critical Metals Corp.

At the closing of the proposed business combination announced on October 24, 2022 between European Lithium AT (Investments) Limited, a wholly owned subsidiary of European Lithium Ltd (ASX: EUR) and Sizzle Acquisition Corp. (Nasdaq: SZZL), Critical Metals is expected to be a leading lithium mining company. Critical Metals is expected to own the Wolfsberg Lithium Project, as well as a 20% interest in additional Austrian projects currently held by European Lithium Ltd. For more information, please visit https://criticalmetalscorp.com/.

About European Lithium Ltd

European Lithium is a mineral exploration and development company which owns the Wolfsberg Lithium Project located in Carinthia, 270 km south of Vienna, Austria, via its wholly owned Austrian subsidiary, ECM Lithium AT GmbH . European Lithium’s primary listing is on the Australian Securities Exchange (ASX: EUR) and it is also listed in Frankfurt (FRA: PF8) and USA (OTC-QB: EULIF). The Wolfsberg Lithium Project is strategically located in Central Europe with access to established road and rail infrastructure to distribute lithium products to the major lithium consuming countries of Europe. For more information, please visit https://europeanlithium.com/.

About Sizzle Acquisition Corp.

Sizzle is a blank check company formed for the purpose of entering into a merger, share exchange, asset acquisition, stock purchase, recapitalization, reorganization or other similar business combination with one or more businesses or entities. Sizzle is led by Chairman and CEO Steve Salis and Vice Chairman Jamie Karson. In addition, Sizzle’s management team is comprised of: Nestor Nova and Daniel Lee; board directors, comprised of: Steve Salis, Jamie Karson, Carolyn Trabuco, Karen Kelley, David Perlin and Warren Thompson; and board advisors, comprised of: Rick Camac and Geovannie Concepcion. For more information, please visit https://sizzlespac.com/home/default.aspx.

Additional Information and Where to Find It

This press release is provided for informational purposes only and contains information with respect to a proposed business combination (the “Proposed Business Combination”) among Sizzle, European Lithium, European Lithium AT (Investments) Limited (the “Company”), a company formed in the British Virgin Islands which is wholly owned by European Lithium, and certain other parties formed in connection with the transactions contemplated by the merger agreement (the “Merger Agreement”), including Critical Metals and Project Wolf Merger Sub Inc., a Delaware corporation and wholly owned subsidiary of Critical Metals. Subject to its terms and conditions, the Merger Agreement provides that Sizzle and the Company will become wholly owned subsidiaries of Critical Metals.

In connection with the Proposed Business Combination, Critical Metals intends to file a registration statement on Form F-4 with the Securities and Exchange Commission (“SEC”), which will include a proxy statement to be sent to Sizzle shareholders and a prospectus for the registration of Critical Metals securities in connection with the Proposed Business Combination (as amended from time to time, the “Registration Statement”). If and when the Registration Statement is declared effective by the SEC, the definitive proxy statement/prospectus and other relevant documents will be mailed to the shareholders of Sizzle as of the record date to be established for voting on the Proposed Business Combination and will contain important information about the Proposed Business Combination and related matters. Shareholders of Sizzle and other interested persons are advised to read, when available, these materials (including any amendments or supplements thereto) and any other relevant documents, because they will contain important information about Sizzle, Critical Metals, European Lithium and the Company and the Proposed Business Combination. Shareholders and other interested persons will also be able to obtain copies of the preliminary proxy statement/prospectus, the definitive proxy statement/prospectus, and other relevant materials in connection with the Proposed Business Combination, without charge, once available, at the SEC’s website at www.sec.gov or by directing a request to: Sizzle Acquisition Corp., 4201 Georgia Avenue, NW, Washington, D.C. 20011, Attn: Steve Salis, Chief Executive Officer. The information contained on, or that may be accessed through, the websites referenced in this press release in each case is not incorporated by reference into, and is not a part of, this press release.

Participants in the Solicitation

This press release is not a solicitation of a proxy from any investor or securityholder. Sizzle, European Lithium, Critical Metals and the Company and their respective directors and executive officers may be deemed participants in the solicitation of proxies from Sizzle’s shareholders in connection with the Proposed Business Combination. Sizzle’s shareholders and other interested persons may obtain, without charge, more detailed information regarding the directors and officers of Sizzle in Sizzle’s Form 10-K, as amended, filed with the SEC on June 13, 2022. To the extent that holdings of Sizzle’s securities have changed since the amounts included in Sizzle’s Form 10-K, such changes have been or will be reflected on Statements of Change in Ownership on Form 4 filed with the SEC. Information regarding the persons who may, under SEC rules, be deemed participants in the solicitation of proxies to Sizzle’s shareholders in connection with the Proposed Business Combination will be set forth in the proxy statement/prospectus for the Proposed Business Combination, accompanying the Registration Statement that Sizzle intends to file with the SEC. Additional information regarding the interests of participants in the solicitation of proxies in connection with the Proposed Business Combination will likewise be included in that Registration Statement. You may obtain free copies of these documents as described above.

No Offer or Solicitation

This press release is not a proxy statement or solicitation of a proxy, consent or authorization with respect to any securities or in respect of the Proposed Business Combination and shall not constitute an offer to sell or a solicitation of an offer to buy any securities, or a solicitation of any vote or approval, nor shall there be any sale of securities in any state or jurisdiction in which such offer, solicitation, or sale would be unlawful prior to registration or qualification under the securities laws of any such state or jurisdiction. No offer of securities shall be made except by means of a prospectus meeting the requirements of the Securities Act of 1933, as amended, or an exemption therefrom.

Cautionary Note Regarding Forward-Looking Statements

This press release contains forward-looking statements within the meaning of the “safe harbor” provisions of the Private Securities Litigation Reform Act of 1995. Sizzle’s, Critical Metals’, European Lithium’s and/or the Company’s actual results may differ from their expectations, estimates and projections and consequently, you should not rely on these forward-looking statements as predictions of future events. Forward-looking statements include statements concerning plans, objectives, goals, strategies, future events or performance, and underlying assumptions and other statements that are other than statements of historical facts. No representations or warranties, express or implied are given in, or in respect of, this press release. When we use words such as “may,” “will,” “intend,” “should,” “believe,” “expect,” “anticipate,” “project,” “estimate” or similar expressions that do not relate solely to historical matters, it is making forward-looking statements.

These forward-looking statements and factors that may cause actual results to differ materially from current expectations include, but are not limited to: the ability of the parties to complete the transactions contemplated by the Proposed Business Combination in a timely manner or at all; the risk that the Proposed Business Combination or other business combination may not be completed by Sizzle’s business combination deadline and the potential failure to obtain an extension of the business combination deadline; the outcome of any legal proceedings or government or regulatory action on inquiry that may be instituted against Sizzle, European Lithium, Critical Metals or the Company or others following the announcement of the Proposed Business Combination and any definitive agreements with respect thereto; the inability to satisfy the conditions to the consummation of the Proposed Business Combination, including the approval of the Proposed Business Combination by the shareholders of Sizzle; the occurrence of any event, change or other circumstance that could give rise to the termination of the Merger Agreement relating to the Proposed Business Combination; the ability to meet stock exchange listing standards following the consummation of the Proposed Business Combination; the effect of the announcement or pendency of the Proposed Business Combination on European Lithium’s, Sizzle’s and the Company’s business relationships, operating results, current plans and operations of European Lithium and the Company; the ability to recognize the anticipated benefits of the Proposed Business Combination, which may be affected by, among other things, competition, the ability of Critical Metals to grow and manage growth profitably; the possibility that Critical Metals, European Lithium, Sizzle and the Company may be adversely affected by other economic, business, and/or competitive factors; Critical Metals’, European Lithium’s and the Company’s estimates of expenses and profitability; expectations with respect to future operating and financial performance and growth, including the timing of the completion of the Proposed Business Combination; European Lithium’s, Sizzle’s and Critical Metals’ ability to execute on their business plans and strategy; those factors discussed in Sizzle’s Annual Report on Form 10-K for the year ended December 31, 2021 under the heading “Risk Factors,” and other documents Sizzle has filed, or that Sizzle or Critical Metals will file, with the SEC; and other risks and uncertainties described from time to time in filings with the SEC.

The foregoing list of factors is not exhaustive. You should carefully consider the foregoing factors and the other risks and uncertainties described in the “Risk Factors” section of the Registration Statement referenced above and other documents filed by Sizzle and Critical Metals from time to time with the SEC. These filings identify and address other important risks and uncertainties that could cause actual events and results to differ materially from those contained in the forward-looking statements. Forward-looking statements speak only as of the date they are made. There may be additional risks that neither Sizzle, Critical Metals, European Lithium and/or the Company presently know, or that Sizzle, Critical Metals, European Lithium and/or the Company currently believe are immaterial, that could cause actual results to differ from those contained in the forward-looking statements. For these reasons, among others, investors and other interested persons are cautioned not to place undue reliance upon any forward-looking statements in this press release. Neither Sizzle, European Lithium, Critical Metals nor the Company undertakes any obligation to publicly revise these forward–looking statements to reflect events or circumstances that arise after the date of this press release, except as required by applicable law.

1 The balance in Sizzle Acquisition Corp’s trust account was $159,213,132.71 as of October 11, 2022.


Contacts

Critical Metals:
Investors: This email address is being protected from spambots. You need JavaScript enabled to view it.
Media: This email address is being protected from spambots. You need JavaScript enabled to view it.

ANAHEIM, Calif.--(BUSINESS WIRE)--Phoenix Motor Inc. (Nasdaq: PEV) (“Company” or “Phoenix”), a leader in manufacturing all-electric, medium-duty vehicles, today announced the appointments of Dr. Frank Lee as Vice President of Engineering, and Dr. Bo Yang as Vice President of Fuel Cell Business.


In commenting on the appointments, Dr. Lance Zhou, CEO of Phoenix Motor Inc., said, “We are excited to add such experienced veterans to the team. Frank brings a wealth of knowledge of the EV development process. Bo will utilize his vast experience in fuel cells and zero-emission, heavy duty trucks and buses to develop and monetize our fuel cell assets.”

Chris Wang, CFO of Phoenix Motor, commented, “The additions of Frank and Bo will add depth to our strong management team as we execute on our global growth strategy and will help guide Phoenix’s trajectory in the rapidly-evolving zero-emission vehicle revolution.”

Dr. Frank Lee brings over 30 years of experience in vehicle development, with expertise in auto body structure, power train integration (EV, EREV, PHEV & ICE) and vehicle integration, as well as vehicle product strategy and product development systems. Dr. Lee most recently served as Vice President of Vehicle Integration at Karma Automotive, an Irvine, CA based EV manufacturer. Previously Dr. Lee has held senior leadership positions including Chief Engineer for BYD Auto, Deputy General Manager for Beiben Trucks, VP and Senior Chief Engineer for Geely Holding Group, as well as senior technique leadership positions in General Motors and Ford Motor Company. Dr. Lee earned his Ph.D. In Engineering Mechanics from Ohio State University, in Columbus, Ohio, and his MA in Mechanics and BS in Mechanics from the Huazhong University of Science and Technology.

Dr. Bo Yang brings 21 years of experience, primarily in fuel cell power systems and zero-emission heavy duty trucks and buses. Dr. Yang most recently served as Air Resources Engineer for the California Air Resources Board, working on numerous zero-emission regulation and deployment projects. Previously, Dr. Yang spent ten years as Senior Product and Process Engineer for Altergy Systems, a fuel cell engineering and manufacturing company, in Folsom, CA. Bo’s early experience was as Research Scientist/Director at Hoku Scientific in Hawaii. Dr. Yang earned his Ph.D. in Materials Science and Engineering from the University of Texas at Austin, his MS in Inorganic Materials and BS in Materials Science and Engineering from Zhejiang University in China.

About Phoenix Motor Inc.

Phoenix Motor Inc., a pioneer in the electric vehicle (“EV”) industry, designs, builds, and integrates electric drive systems and light and medium duty EVs and sells electric forklifts and electric vehicle chargers for the commercial and residential markets. Phoenix operates two primary brands, “Phoenix Motorcars”, which is focused on commercial products including medium duty EVs (shuttle buses, school buses, municipal transit vehicles and delivery trucks, among others), electric vehicle chargers and electric forklifts, and “EdisonFuture”, which intends to offer light-duty EVs. Phoenix endeavors to be a leading designer, developer and manufacturer of electric vehicles and electric vehicle technologies. For more information, please visit: www.phoenixmotorcars.com and www.edisonfuture.com.

Forward-Looking Statements

This press release contains forward-looking statements as defined by the Private Securities Litigation Reform Act of 1995. Forward-looking statements include statements concerning plans, objectives, goals, strategies, future events or performance, and underlying assumptions and other statements that are other than statements of historical facts. When the Company uses words such as “may,” “will,” “intend,” “should,” “believe,” “expect,” “anticipate,” “project,” “estimate” or similar expressions that do not relate solely to historical matters, it is making forward-looking statements. Forward-looking statements are no guarantee of future performance and involve risks and uncertainties that may cause the actual results to differ materially from the Company’s expectations discussed in the forward-looking statements. These statements are subject to uncertainties and risks including, but not limited to, the following: the Company’s ability to convert concept trucks and vans into production and sales; the Company’s product development timeline and expected start of production; development of competitive trucks and vans manufactured and sold by the Company’s competitors and major industry vehicle companies; the Company’s ability to scale in a cost-effective manner; the Company’s future capital requirements and sources and uses of cash; the Company’s ability to obtain funding for its future operations; the Company’s financial and business performance; changes in the Company’s strategy, future operations, financial position, estimated revenues and losses, projected costs, prospects and plans; the implementation, market acceptance and success of its business model; expectations regarding the Company’s ability to obtain and maintain intellectual property protection and not infringe on the rights of others; and other risks contained in the Offering prospectus and reports filed by the Company with the SEC. For these reasons, among others, investors are cautioned not to place undue reliance upon any forward-looking statements in this press release. Additional factors are discussed in the Company’s filings with the SEC, including those set forth in the Risk Factors section of the Company's registration statement and Offering prospectus, which are available for review at www.sec.gov. The Company undertakes no obligation to publicly revise these forward-looking statements to reflect events or circumstances that arise after the date hereof.


Contacts

Investor Relations Contacts:
Mark Hastings, SVP & Head of Investor Relations
Sioban Hickie, ICR Inc.
This email address is being protected from spambots. You need JavaScript enabled to view it.

  • Quarterly net income of $2,031 million and cash flow from operating activities of $3,089 million
  • Upstream production of 430,000 gross oil-equivalent barrels per day driven by strong production at Kearl and Cold Lake
  • Sustained strong Downstream operating performance with quarterly refinery capacity utilization of 100%, highest in over 40 years
  • Reduced debt by $1 billion using proceeds from the sale of interests in XTO Energy Canada
  • Quarterly dividend increased by 29 percent from 34 cents to 44 cents per share
  • Completed accelerated normal course issuer bid program in October, returning over $1.9 billion to shareholders
  • Announced intention to initiate a substantial issuer bid to purchase up to $1.5 billion of its common shares
  • Released annual Corporate Sustainability Report, outlining the company's environmental, social and governance progress and focus areas

CALGARY, Alberta--(BUSINESS WIRE)--Imperial (TSE: IMO) (NYSE American: IMO):


Third quarter


Nine months

millions of Canadian dollars, unless noted

2022


2021


2022


2021


Net income (loss) (U.S. GAAP)

2,031


908


+1,123


5,613


1,666


+3,947

Net income (loss) per common share, assuming dilution (dollars)

3.24


1.29


+1.95


8.58


2.31


+6.27

Capital and exploration expenditures

392


277


+115


1,002


699


+303

Imperial reported estimated net income in the third quarter of $2,031 million, compared to $2,409 million in the second quarter of 2022, as strong operating performance partly offset moderating commodity prices. Cash flow from operating activities was $3,089 million, up from $2,682 million in the second quarter of 2022.

Imperial’s business lines delivered another quarter of exceptional operating performance, increasing the supply of crude and fuel products to support Canadian and global energy needs,” said Brad Corson, chairman, president and chief executive officer. “Our on-going focus on safe and reliable operations underpins our strong financial results and positions us well to continue capturing value from the current commodity price environment.”

Upstream production in the third quarter averaged 430,000 gross oil-equivalent barrels per day. At Kearl, quarterly total gross production increased substantially from the second quarter of 2022 to an average of 271,000 barrels per day following the completion of its annual turnaround. Subsequent to the third quarter, Kearl's October production continued to increase, achieving multiple single-day production records. At Cold Lake, quarterly production averaged 150,000 gross barrels per day, representing the fourth consecutive quarter with production at or above 140,000 barrels per day. Given the success of the company’s on-going optimization program and continued production strength at Cold Lake, Imperial is increasing its full-year guidance at Cold Lake to between 140,000 to 145,000 gross barrels per day for 2022.

In the Downstream, quarterly refining throughput averaged 426,000 barrels per day, with capacity utilization of 100 percent, the highest quarterly utilization in over 40 years, ensuring a stable supply of fuel products to meet Canadian demand. Petroleum product sales remained strong in the quarter, averaging 484,000 barrels per day. In September, Imperial signed a long-term contract with Air Products to supply low-carbon hydrogen for the company’s planned renewable diesel complex at its Strathcona refinery. A final investment decision for the renewable diesel complex is expected in the coming months.

In August, Imperial successfully completed the previously announced sale of its XTO Energy Canada assets to Whitecap Resources for a total cash consideration of approximately $0.9 billion (Imperial’s share), resulting in an after-tax gain of $208 million in the quarter. Proceeds from the sale were used to reduce debt by $1 billion, bringing the company's outstanding debt to $4.2 billion and debt-to-capital1 ratio to 16 percent.

The sale of Imperial’s XTO assets positions the company well to not only continue focusing Upstream resources on our core oil sands assets but also enabled us to further enhance our industry leading balance sheet and improve the company’s financial flexibility,” said Corson.

During the quarter, Imperial returned to shareholders $227 million in dividends paid and $1,512 million through accelerated share repurchases under the company's normal course issuer bid (NCIB) program. The company completed its NCIB program in October with an additional $434 million in share repurchases.

Paying a reliable and growing dividend and returning surplus cash to shareholders remain key priorities for us” said Corson. “Imperial has generated substantial value for its shareholders this year and I am pleased to announce a 29 percent increase to our quarterly dividend as well as our plans to initiate a second substantial issuer bid this year, returning up to $1.5 billion to shareholders in the fourth quarter” said Corson.

Imperial continues to advance solutions to lower emissions in its operations. The company is a founding member of the Pathways Alliance, which continues to move forward with early work to support a major carbon capture and storage network in support of Canada’s goals to achieve net zero emissions. In early October, the Government of Alberta awarded the Pathways Alliance pore space to continue exploratory work on the development of a hub to safely and permanently store CO2 from over 20 industry oil sands facilities and other interested industries in northern Alberta.

In September, Imperial released its annual Sustainability report which highlights progress and momentum in the company’s key environmental, social and governance focus areas and complements the company’s Advancing Climate Solutions report published earlier this year.

The challenges we are facing today require collaboration across industry, governments, indigenous communities and other stakeholders,” said Corson. “It’s why we became a founding member of the Pathways Alliance to reduce oil sands emissions and to further develop and deploy game changing technology to meaningfully contribute to Canada’s energy future.”

Third quarter highlights

  • Net income of $2,031 million or $3.24 per share on a diluted basis, up from $908 million or $1.29 per share in the third quarter of 2021. Net income excluding identified items1 of $1,823 million in the third quarter of 2022, up from $908 million in the same period of 2021.
  • Cash flows from operating activities of $3,089 million, up from $1,947 million in the same period of 2021. Cash flows from operating activities excluding working capital1 of $2,543 million, up from $1,504 million in the same period of 2021.
  • Capital and exploration expenditures totalled $392 million, up from $277 million in the third quarter of 2021.
  • The company returned $1,739 million to shareholders in the third quarter of 2022, including $227 million in dividends paid and $1,512 million in share repurchases. Subsequent to the end of the third quarter, the company completed its NCIB program with an additional $434 million in share repurchases.
  • Announced intention to initiate a substantial issuer bid to purchase for cancellation up to $1.5 billion of its common shares. The company anticipates terms and pricing will be determined and the offer will commence during the next two weeks.
  • Production averaged 430,000 gross oil-equivalent barrels per day, compared to 435,000 barrels per day in the same period of 2021.
  • Total gross bitumen production at Kearl averaged 271,000 barrels per day (193,000 barrels Imperial's share), compared to 274,000 barrels per day (194,000 barrels Imperial's share) in the third quarter of 2021. Subsequent to the third quarter, Kearl’s October production continued to increase, achieving multiple single-day production records.
  • Gross bitumen production at Cold Lake averaged 150,000 barrels per day, up from 135,000 barrels per day in the third quarter of 2021, representing the fourth consecutive quarter with production at or above 140,000 barrels per day. Consistent with this sustained production performance, Imperial is increasing its 2022 production guidance at Cold Lake to between 140,000 - 145,000 barrels per day.
  • The company's share of gross production from Syncrude averaged 62,000 barrels per day, compared to 78,000 barrels per day in the third quarter of 2021, primarily driven by the timing of planned turnaround activities.
  • Refinery throughput averaged 426,000 barrels per day, up from 404,000 barrels per day in the third quarter of 2021. Capacity utilization reached 100 percent, the highest quarterly utilization in over 40 years, up from 94 percent in the third quarter of 2021, as the company continues to maximize production to meet Canadian demand.
  • Petroleum product sales were 484,000 barrels per day, compared to 485,000 barrels per day in the third quarter of 2021.
  • Chemical net income of $54 million in the quarter, compared to $121 million in the third quarter of 2021. Lower income was primarily driven by lower polyethylene margins.
  • Announced long-term contract with Air Products to supply low-carbon hydrogen for Imperial’s proposed renewable diesel complex near Edmonton, Alberta. The complex is expected to produce more than 1 billion litres of renewable diesel per year from locally sourced feedstock and low-carbon hydrogen. A final investment decision will be made in the coming months.
  • Completed, together with ExxonMobil Canada, the previously announced sale of XTO Energy Canada to Whitecap Resources for total cash consideration of approximately $1.9 billion ($0.9 billion Imperial’s share). As a result of the sale, Imperial recorded an after-tax gain of approximately $208 million in the third quarter of 2022. Proceeds from the sale were used to reduce outstanding debt by $1 billion, further enhancing the company’s industry leading balance sheet and improving financial flexibility.
  • As a member of the Pathways Alliance, advanced early work to support the foundational carbon capture and storage network in northern Alberta as part of Pathways' goal to achieve net zero emissions. In early October, the Government of Alberta awarded the Pathways Alliance pore space to continue exploratory work on the development of a hub to safely and permanently store CO2 from over 20 industry oil sands facilities and other interested industries in northern Alberta.
  • Released annual Corporate Sustainability Report. The report highlights key environmental, social and governance focus areas and progress, complementing the company’s previously released Advancing Climate Solutions report.
  • Announced unique collaboration with FLO that will support Canada’s net zero emissions goals by expanding FLO’s charging network for electric vehicles. This collaboration will jointly develop an electric vehicle charging service option for Imperial’s Esso and Mobil branded wholesalers and includes an agreement to transfer credits to Imperial under Canada’s Clean Fuel Regulations.

Current business environment

During the COVID-19 pandemic, industry investment to maintain and increase production capacity was restrained to preserve capital, resulting in underinvestment and supply tightness as demand for petroleum and petrochemical products recovered. Across late 2021 and the first half of 2022, this dynamic, along with supply chain constraints and a continuation of demand recovery, led to a steady increase in oil and natural gas prices and refining margins. In the first half of 2022, tightness in the oil and natural gas markets was further exacerbated by Russia’s invasion of Ukraine and subsequent sanctions imposed upon business and other activities in Russia. The price of crude oil and certain regional natural gas indicators increased to levels not seen for several years. Across the third quarter of 2022, high prices and economic uncertainty led to a tempering of demand for some products, causing crude oil prices and refining margins to soften relative to first half levels. Commodity and product prices are expected to remain volatile given the current global economic and geopolitical uncertainty affecting supply and demand.

Operating results
Third quarter 2022 vs. third quarter 2021


Third Quarter

millions of Canadian dollars, unless noted

2022


2021

Net income (loss) (U.S. GAAP)

2,031


908

Net income (loss) per common share, assuming dilution (dollars)

3.24


1.29

Net income (loss) excluding identified items1

1,823


908


Current quarter results include favourable identified items1 of $208 million related to the company's gain on the sale of interests in XTO Energy Canada.

Upstream

Net income (loss) factor analysis

millions of Canadian dollars


2021

Price

Volumes

Royalty

Identified

Items¹

Other

2022

524

660

(100)

(210)

208

(96)

986

Price – Higher realizations were generally in line with increases in marker prices, driven primarily by increased demand and supply chain constraints. Average bitumen realizations increased by $21.14 per barrel generally in line with WCS, and synthetic crude oil realizations increased by $38.86 per barrel generally in line with WTI.

Volumes – Lower volumes were the result of timing of planned turnaround activities at Syncrude, partially offset by higher volumes at Cold Lake, primarily driven by continued focus on sustained performance and production optimization.

Royalty – Higher royalties primarily driven by improved commodity prices.

Identified Items1 – Current quarter results include favourable identified items1 related to the company's gain on the sale of interests in XTO Energy Canada.

Other – Includes higher operating expenses of about $200 million, partially offset by favourable foreign exchange impacts of about $80 million.

Marker prices and average realizations


Third Quarter

Canadian dollars, unless noted

2022


2021

West Texas Intermediate (US$ per barrel)

91.43


70.52

Western Canada Select (US$ per barrel)

71.53


57.08

WTI/WCS Spread (US$ per barrel)

19.90


13.44

Bitumen (per barrel)

81.58


60.44

Synthetic crude oil (per barrel)

124.80


85.94

Average foreign exchange rate (US$)

0.77


0.79

Production


Third Quarter

thousands of barrels per day

2022


2021

Kearl (Imperial's share)

193


194

Cold Lake

150


135

Syncrude (a)

62


78


Kearl total gross production (thousands of barrels per day)

271


274

(a)

In the third quarter of 2022, Syncrude gross production included about 7 thousand barrels per day of bitumen and other products (2021 - 1 thousand barrels per day) that was exported to the operator's facilities using an existing interconnect pipeline.

Higher production at Cold Lake was primarily driven by continued focus on sustained performance and production optimization.

Lower production at Syncrude was primarily a result of the timing of planned turnaround activities.

Downstream

Net income (loss) factor analysis

millions of Canadian dollars


2021

Margins

Other

2022

293

710

9

1,012

Margins – Higher margins primarily reflect improved market conditions.

Refinery utilization and petroleum product sales


Third Quarter

thousands of barrels per day, unless noted

2022


2021

Refinery throughput

426


404

Refinery capacity utilization (percent)

100


94

Petroleum product sales

484


485

Improved refinery throughput in the third quarter of 2022 was primarily driven by economic optimization across the downstream supply chain.

Chemicals

Net income (loss) factor analysis

millions of Canadian dollars


2021

Margins

Other

2022

121

(60)

(7)

54

Margins – Lower margins primarily reflect weaker industry polyethylene margins.

Corporate and other


Third Quarter

millions of Canadian dollars

2022


2021

Net income (loss) (U.S. GAAP)

(21)


(30)

Liquidity and capital resources


Third Quarter

millions of Canadian dollars

2022


2021

Cash flow generated from (used in):


Operating activities

3,089


1,947

Investing activities

364


(259)

Financing activities

(2,744)


(589)

Increase (decrease) in cash and cash equivalents

709


1,099


Cash and cash equivalents at period end

3,576


1,875

Cash flow generated from operating activities primarily reflects higher Upstream realizations, improved Downstream margins, and favourable working capital impacts.

Cash flow generated from investing activities primarily reflects proceeds from the sale of interests in XTO Energy Canada, partially offset by higher additions to property, plant and equipment.

Cash flow used in financing activities primarily reflects:


Third Quarter

millions of Canadian dollars, unless noted

2022


2021

Dividends paid

227


195

Per share dividend paid (dollars)

0.34


0.27

Share repurchases (a)

1,512


313

Number of shares purchased (millions) (a)

25.2


9.0

(a)

Share repurchases were made under the company's normal course issuer bid program, and include shares purchased from Exxon Mobil Corporation concurrent with, but outside of the normal course issuer bid.

During the third quarter of 2022, the company decreased its long-term debt by $1 billion by partially repaying an existing facility with an affiliated company of ExxonMobil.

Nine months 2022 vs. nine months 2021


Nine Months

millions of Canadian dollars, unless noted

2022


2021

Net income (loss) (U.S. GAAP)

5,613


1,666

Net income (loss) per common share, assuming dilution (dollars)

8.58


2.31

Net income (loss) excluding identified items1

5,405


1,666

Current year results include favourable identified items1 of $208 million related to the company's gain on the sale of interests in XTO Energy Canada.

Upstream

Net income (loss) factor analysis

millions of Canadian dollars


2021

Price

Volumes

Royalty

Identified

Items¹

Other

2022

850

3,320

(160)

(920)

208

(184)

3,114

Price – Higher realizations were generally in line with increases in marker prices, driven primarily by increased demand and supply chain constraints. Average bitumen realizations increased by $38.71 per barrel generally in line with WCS, and synthetic crude oil realizations increased by $51.90 per barrel generally in line with WTI.

Volumes – Lower volumes were primarily the result of downtime at Kearl in the first half of the year.

Royalty – Higher royalties primarily driven by improved commodity prices.

Identified Items1 – Current year results include favourable identified items1 related to the company's gain on the sale of interests in XTO Energy Canada.

Other – Includes higher operating expenses of about $430 million, primarily higher energy prices, partially offset by favourable foreign exchange impacts of about $130 million.

Marker prices and average realizations


Nine Months

Canadian dollars, unless noted

2022


2021

West Texas Intermediate (US$ per barrel)

98.25


65.04

Western Canada Select (US$ per barrel)

82.60


52.45

WTI/WCS Spread (US$ per barrel)

15.65


12.59

Bitumen (per barrel)

94.01


55.30

Synthetic crude oil (per barrel)

129.52


77.62

Average foreign exchange rate (US$)

0.78


0.80

Production


Nine Months

thousands of barrels per day

2022


2021

Kearl (Imperial's share)

162


185

Cold Lake

145


139

Syncrude (a)

74


68


Kearl total gross production (thousands of barrels per day)

228


260

(a)

In 2022, Syncrude gross production included about 4 thousand barrels per day of bitumen and other products (2021 - 1 thousand barrels per day) that was exported to the operator's facilities using an existing interconnect pipeline.

Lower production at Kearl was primarily a result of downtime in the first half of the year.

Downstream

Net income (loss) factor analysis

millions of Canadian dollars


2021

Margins

Other

2022

645

1,680

109

2,434

Margins – Higher margins primarily reflect improved market conditions.

Other – Includes lower turnaround impacts of about $140 million, reflecting the absence of turnaround activities at Strathcona refinery and favourable foreign exchange impacts of about $70 million, partially offset by higher operating expenses of about $130 million, primarily from higher energy costs.

Refinery utilization and petroleum product sales


Nine Months

thousands of barrels per day, unless noted

2022


2021

Refinery throughput

413


367

Refinery capacity utilization (percent)

96


86

Petroleum product sales

471


442

Improved refinery throughput in 2022 was primarily driven by reduced turnaround activity and increased demand.

Improved petroleum product sales in 2022 primarily reflects increased demand.

Chemicals

Net income (loss) factor analysis

millions of Canadian dollars


2021

Margins

Other

2022

297

(90)

(44)

163

Margins – Lower margins primarily reflect weaker industry polyethylene margins.

Corporate and other


Nine Months

millions of Canadian dollars

2022


2021

Net income (loss) (U.S. GAAP)

(98)


(126)

Liquidity and capital resources


Nine Months

millions of Canadian dollars

2022


2021

Cash flow generated from (used in):


Operating activities

7,685


3,844

Investing activities

(145)


(613)

Financing activities

(6,117)


(2,127)

Increase (decrease) in cash and cash equivalents

1,423


1,104

Cash flow generated from operating activities primarily reflects higher Upstream realizations, improved Downstream margins, and favourable working capital impacts.

Cash flow used in investing activities primarily reflects proceeds from the sale of interests in XTO Energy Canada, partially offset by higher additions to property, plant and equipment.

Cash flow used in financing activities primarily reflects:


Nine Months

millions of Canadian dollars, unless noted

2022


2021

Dividends paid

640


518

Per share dividend paid (dollars)

0.95


0.71

Share repurchases (a)

4,461


1,484

Number of shares purchased (millions) (a)

66.6


38.5

(a)

Share repurchases were made under the company’s normal course issuer bid program and substantial issuer bid that commenced on May 6, 2022 and expired on June 10, 2022. Includes shares purchased from Exxon Mobil Corporation concurrent with, but outside of, the normal course issuer bid, and by way of a proportionate tender under the company’s substantial issuer bid.

During the third quarter of 2022, the company decreased its long-term debt by $1 billion by partially repaying an existing facility with an affiliated company of ExxonMobil.

On May 6, 2022, the company commenced a substantial issuer bid pursuant to which it offered to purchase for cancellation up to $2.5 billion of its common shares through a modified Dutch auction and proportionate tender offer. The substantial issuer bid was completed on June 15, 2022, with the company taking up and paying for 32,467,532 common shares at a price of $77.00 per share, for an aggregate purchase of $2.5 billion and 4.9 percent of Imperial’s issued and outstanding shares at the close of business on May 2, 2022. This included 22,597,379 shares purchased from Exxon Mobil Corporation by way of a proportionate tender to maintain its ownership percentage at approximately 69.6 percent.

Subsequent to the end of the third quarter, the company completed all share repurchases under its normal course issuer bid on October 21, 2022.

On October 28, 2022 the company announced its intention to launch a substantial issuer bid pursuant to which the company will offer to purchase for cancellation up to $1.5 billion of its common shares. The substantial issuer bid will be made through a modified Dutch auction, with a tender price range to be determined by the company at the time of commencement of the offer. Shares may also be tendered by way of a proportionate tender, which will result in a shareholder maintaining their proportionate share ownership. ExxonMobil has advised Imperial that it intends to make a proportionate tender in connection with the offer in order to maintain its proportionate share ownership at approximately 69.


Contacts

Investor relations
(587) 476-4743

Media relations
(587) 476-7010


Read full story here

PORTLAND, Ore.--(BUSINESS WIRE)--Today GridStor, a developer and operator of grid-scale battery energy storage systems, announced the acquisition of a portfolio of storage projects currently in development in the greater Los Angeles area from Upstream Energy of San Diego. The portfolio consists of multiple projects representing over 500 MW / 2,000 MWh of capacity, or enough to power 375,000 California homes, with proposed on-line dates between 2024 to 2026.


The projects will be going online in an important time for California’s transition to clean energy, as the state works toward a carbon free electricity system by 2045. To meet these goals, the California Energy Commission projects that 49,000 MW of battery storage will be needed.

“California has urgent reliability needs, and battery storage is the best way to consistently incorporate clean energy onto the grid and curtail our dependence on fossil fuels,” said Chris Taylor, CEO of GridStor. “The large size and strategic locations of these new projects will position GridStor to become a major player in the California energy storage market as the transition to clean energy continues.”

The battery storage projects will be built on previously disturbed sites in urban areas in the LA basin area near existing power lines and substations, allowing the batteries to quickly connect to the electric grid upon completion. Once online, the projects will provide needed capacity for regional utilities to ensure power grid reliability and will be key to the increasing volumes of renewable energy being added to the state’s electric grid and managed by California's Independent System Operator (CAISO).

Once operating, the projects will aim to:

  • Increase the resilience of the electric grid, helping ensure reliable power supply
  • Allow grid operators to integrate more solar and wind power by storing renewable energy in periods of peak generation and delivering it during times of peak demand
  • Generate large capital investments on underutilized land near existing grid infrastructure in urban and suburban areas
  • Support local, state, and federal clean energy goals
  • Create union construction jobs and contribute property taxes for host communities

“We look forward to collaborating with the GridStor team in the deployment of this critical part of the State’s electrical infrastructure,” said Ryan Hulett, Principal at Upstream Energy.

GridStor was established to build the critical infrastructure needed to transition the electricity grid toward a renewable, low-carbon future. GridStor is backed by the Sustainability and Infrastructure Investing groups within Goldman Sachs Asset Management (Goldman Sachs), a leading clean energy investor. GridStor has assembled a team of experienced professionals with over 125 years of combined energy experience to develop, design, construct and operate battery storage systems at scale.

GridStor’s target markets include regions seeing rapid growth of renewable energy sources, retirements of thermal power plants, increasing grid instability due to unpredictable climate events such as extreme heat and wildfires, and areas seeing higher energy demand and aging grid infrastructure.

Marathon Capital acted as exclusive financial advisor to Upstream Energy.

About GridStor

GridStor is enabling the transition to a clean energy grid by deploying flexible grid-connected batteries at scale. GridStor develops, acquires, and operates utility-scale, standalone battery storage projects primarily across North America. Visit us at www.gridstor.com and on LinkedIn.

About Goldman Sachs Asset Management

Bringing together traditional and alternative investments, Goldman Sachs Asset Management provides clients around the world with a dedicated partnership and focus on long-term performance. As the primary investing area within Goldman Sachs (NYSE: GS), we deliver investment and advisory services for the world’s leading institutions, financial advisors, and individuals, drawing from our deeply connected global network and tailored expert insights, across every region and market—overseeing more than $2 trillion in assets under supervision worldwide as of September 30, 2022. Driven by a passion for our clients’ performance, we seek to build long-term relationships based on conviction, sustainable outcomes, and shared success over time. Follow us on LinkedIn.


Contacts

Media Contact
Cassidy Monda
This email address is being protected from spambots. You need JavaScript enabled to view it.
503-320-3588

CALGARY, Alberta--(BUSINESS WIRE)--Imperial Oil Limited (TSE: IMO, NYSE American: IMO) today declared a quarterly dividend of 44 cents per share on the outstanding common shares of the company, payable on January 1, 2023, to shareholders of record at the close of business on December 2, 2022.


This fourth quarter 2022 dividend compares with the third quarter 2022 dividend of 34 cents per share.

Imperial has a long and successful history of growth and financial stability in Canada as a leading member of the petroleum industry. The company has paid dividends every year for over a century and has increased its annual dividend payment for 28 consecutive years.

Source: Imperial

After more than a century, Imperial continues to be an industry leader in applying technology and innovation to responsibly develop Canada’s energy resources. As Canada’s largest petroleum refiner, a major producer of crude oil, a key petrochemical producer and a leading fuels marketer from coast to coast, our company remains committed to high standards across all areas of our business.


Contacts

Investor relations
(587) 476-4743

Media relations
(587) 476-7010

DUBLIN--(BUSINESS WIRE)--The "Supercapacitor Market - Forecasts from 2022 to 2027" report has been added to ResearchAndMarkets.com's offering.


The supercapacitor market is projected to grow at a CAGR of 20.69% during the forecast period to reach US$3,010.052 million by 2027, from US$807.096 million in 2020. Supercapacitors, double-layered capacitors, or ultracapacitors, are electronic devices with a comparatively higher capacitance value and lower voltage ranges. These energy storage devices are capable of bridging the gap between traditional capacitors and batteries.

Furthermore, their ability to store more energy than typical capacitors and produce more power than standard batteries, coupled with long-term stability and high cyclability, makes them appealing as energy storage devices. Owing to such attributes, they are found in diverse applications, either as an autonomous energy source or in combination with other energy storage devices like batteries. In particular, supercapacitors are commonly found in applications with fluctuating loads, such as portable media players, PDAs, GPS, and laptops.

They are also being used in microgrids to store energy in reverse conditions while quickly injecting power whenever demand is high, and production is low in the grids. Furthermore, they are also found in energy harvesting solutions, automotive segments, aerospace, and industrial segments. The growth in demand for supercapacitors in the aforementioned industries is expected to add impetus to the growth of the supercapacitor market.

Growth Factors:

The increase in electric automobile production is expected to increase the demand for supercapacitors in the projected period.

One of the most awaited innovations of the century is cost-effective, long-range, efficient electric vehicles. Power storage is arguably the most crucial component of an electric vehicle, with the tremendous potential to enable electric vehicles to outperform internal combustion engine vehicles. Supercapacitors are commonly used to deal with the storage issues of typical batteries. A supercapacitor's high-power density enables it to quickly charge or discharge a large amount of power without compromising its potential to sequester energy.

This makes supercapacitors advantageous in scenarios where a large amount of power must be supplied or captured in a short period of time, such as acceleration and regenerative braking, where supercapacitors capture the kinetic energy from deceleration that is normally dissipated as heat. As a result, supercapacitors are frequently used in hybrid vehicles like the Toyota FCHV and Lamborghini Sian. Several other automobile manufacturers are employing supercapacitors in their offering, owing to these appealing features.

For instance, in India, Omega Selki Pvt Ltd and Log 9 materials entered into a strategic partnership and launched a Rage+ Rapid EV in November 2021. With the latter's expertise in supercapacitor technology, this battery's performance is superior to that of typical EV batters. With this launch, the former is set to revolutionize the Indian EV market. Furthermore, according to Volkswagen's forecast in its 2021 Annual Report, the global market share of electric vehicles is expected to reach 50% by 2030. The growing number of renewable projects in recent years is yet another growth factor fuelling the expansion of market size.

The growing awareness of environmental sustainability, as well as numerous initiatives undertaken by governments and businesses, has resulted in an increase in the number of renewable projects. For instance, in March 2022, the state-run PGCIL (Power Grid Corporation of India) announced the approval of 5 power-grid projects worth 821 crores to strengthen the transmission system across multiple Indian states. While in East Asia, in November 2021, China Southern Power Grid, the country's major power grid, declared its intention to invest US$ 105 billion in grid network construction in the period 2021-2025 to boost renewable power consumption and power stability.

Market Segments:

By Type

  • Pseudocapacitors
  • Hybrid Capacitors
  • Double Layer Supercapacitors

By Capacitance

  • Upto 100F
  • 100F - 1000F
  • More than 1000F

By Industry Vertical

  • Consumer Electronics
  • Automotive
  • Energy and Power
  • Aerospace
  • Industrial

By Geography

  • North America
  • US
  • Canada
  • Mexico
  • South America
  • Brazil
  • Argentina
  • Europe
  • Germany
  • France
  • UK
  • Italy
  • Middle East and Africa
  • Saudi Arabia
  • UAE
  • Asia Pacific
  • China
  • Japan
  • India
  • South Korea
  • Taiwan
  • Thailand
  • Indonesia

Key Topics Covered:

1. INTRODUCTION

2. RESEARCH METHODOLOGY

3. EXECUTIVE SUMMARY

4. MARKET DYNAMICS

5. SUPERCAPACITOR MARKET ANALYSIS, BY TYPE

6. SUPERCAPACITOR MARKET ANALYSIS, BY CAPACITANCE

7. SUPERCAPACITOR MARKET ANALYSIS, BY INDUSTRY VERTICAL

8. SUPERCAPACITOR MARKET ANALYSIS, BY GEOGRAPHY

9. COMPETITIVE ENVIRONMENT AND ANALYSIS

10. COMPANY PROFILES

Companies Mentioned

  • Tokin Corporation
  • Skeleton Technologies
  • Maxwell Technologies, Inc. (acquired by Tesla, Inc.)
  • Nippon Chemi-Con Corporation
  • Panasonic Corporation
  • Eaton
  • CAP-XX
  • IOXUS Inc.
  • LS Mtron
  • NAWATechnologies

For more information about this report visit https://www.researchandmarkets.com/r/4vl0a


Contacts

ResearchAndMarkets.com
Laura Wood, Senior Press Manager
This email address is being protected from spambots. You need JavaScript enabled to view it.

For E.S.T Office Hours Call 1-917-300-0470
For U.S./ CAN Toll Free Call 1-800-526-8630
For GMT Office Hours Call +353-1-416-8900

DUBLIN--(BUSINESS WIRE)--The "Smart Energy Management Market by Energy Source, Offering, Function, End User and Geography - Global Forecasts to 2029" report has been added to ResearchAndMarkets.com's offering.


The global smart energy management market is expected to reach $47.64 billion by 2029, growing at a CAGR of 15.0% during the forecast period of 2022-2029.

The growth of this market is attributed to the rising energy consumption and price volatility, increasing awareness about carbon footprint management, growing inclination towards efficient energy management, and rising inclination towards corporate responsibility and brand image.

In addition, modernization of aging infrastructure, upcoming smart city projects in developing economies, and integration of energy management systems with smart devices is expected to offer significant growth opportunities for the growth of this market.

However, the high initial cost of deployment, non-standardized guidelines, and lack of financial resources restrains the growth of this market to a certain extent.

Key questions answered in the report:

  • Which are the high-growth market segments in terms of energy source, offering, function, end user, and countries?
  • What is the historical market for smart energy management across the globe?
  • What are the market forecasts and estimates from 2022-2029?
  • What are the major drivers, restraints, and opportunities in the global smart energy management market?
  • Who are the major players in the global smart energy management market, and what shares of the market do they hold?
  • Who are the major players in various countries, and what shares of the market do they hold?
  • How is the competitive landscape?
  • What are the recent developments in the global smart energy management market?
  • What are the different strategies adopted by the major players in the global smart energy management market?
  • What are the geographical trends and high-growth countries?
  • Who are the local emerging players in the global smart energy management market and how do they compete with the other players?

Companies Mentioned

  • Asea Brown Boveri Ltd.
  • General Electric Company
  • Honeywell International Inc.
  • Schneider Electric SE
  • Emerson Electric Co.
  • Johnson Controls International Plc
  • Cisco Systems Inc.
  • Siemens AG
  • Driivz Ltd.
  • Telit
  • Tata Consultancy Services
  • Robert Bosch GmbH
  • Panasonic Corporation
  • LG Electronics Inc.
  • NEC Corporation
  • SAGE Automation
  • Vivint Inc.
  • Alarm.com
  • Ecobee
  • EnergyHub Inc.
  • Comcast Cable
  • EcoFactor Inc.

Scope of the Report:

Smart Energy Management Market, by Energy Source

  • Renewable
  • Solar
  • Wind
  • Others
  • Non-Renewable/Conventional

Smart Energy Management Market, by Offering

  • Solution
  • Smart Meters
  • Data and Device Management
  • PV Monitoring
  • Smart Grid
  • Power Electronics Devices
  • Smart Energy Storage
  • Communication Network Devices
  • Other Solutions (Automatic Transfer Switch)
  • Software
  • Consulting & Services

Smart Energy Management Market, by Function

  • Grid Operation
  • Meter Data Management
  • Grid Control, Management, & Monitoring
  • Distribution Automation
  • Microgrid Management
  • Others (Smart Communication & Wide Area Monitoring)
  • Renewable Energy Management
  • Distributed Energy Management
  • Energy Storage
  • Grid Security / Cybersecurity

Smart Energy Management Market, by End User

  • Energy Utilities Providers
  • Consumers
  • Residential
  • Commercial
  • Industrial
  • Manufacturing
  • Construction
  • Telecom and IT
  • Government & Public Sector
  • Healthcare
  • Other Industrial End-Users

Smart Energy Management Market, by Geography

  • North America
  • U.S.
  • Canada
  • Europe
  • Germany
  • U.K.
  • France
  • Italy
  • Spain
  • Sweden
  • Denmark
  • Rest of Europe
  • Asia-Pacific
  • Japan
  • China
  • India
  • South Korea
  • Singapore
  • Malaysia
  • Australia & New Zealand
  • Rest of Asia-Pacific
  • Latin America
  • Brazil
  • Mexico
  • Rest of Latin America
  • Middle East & Africa
  • UAE
  • Israel
  • Rest of MEA

For more information about this report visit https://www.researchandmarkets.com/r/hy9l78


Contacts

ResearchAndMarkets.com
Laura Wood, Senior Press Manager
This email address is being protected from spambots. You need JavaScript enabled to view it.
For E.S.T Office Hours Call 1-917-300-0470
For U.S./ CAN Toll Free Call 1-800-526-8630
For GMT Office Hours Call +353-1-416-8900

SAN DIEGO--(BUSINESS WIRE)--Eolica Coromuel, S. De R.L. De C.V., an affiliate of Eurus Energy America Corporation, has begun commercial operation of Baja California Sur’s first wind generating facility. The 50-megawatt project built by Eolica Coromuel, Eurus Energy America’s Mexican subsidiary, began operating and is Eurus’ first investment within Mexico’s energy sector.


The project incorporates a 10 MW battery system that offers additional ancillary service support and grid reliability to Baja California Sur’s electrical system - generation from the facility is sold directly into the wholesale power market.

“The State of Baja California Sur has growing electricity demand. Coromuel project will provide this special region with renewable wind generation and contribute to overall grid stability via its integrated battery energy storage system,” said Hidenori Mitsuoka, President and CEO of Eurus Energy America.

“Responding to the region’s need for low-cost, carbon-free energy, Eurus proceeded with construction of this important project even though the pandemic, supply-chain disruptions and global economic volatility have made major projects more difficult over the past three years,” Mitsuoka added. “Eurus is committed to helping Mexico move forward toward a more sustainable future.”

Mitsuoka noted that successful completion of the project is due to the collective efforts of many, including Eurus’ contractor, Elecnor; its equipment suppliers GE and Wartsila; and valued landowner partners. Support from the state government, the Centro Nacional de Control de Energía and the Comisión Federal de Electricidad was indispensable, he added.

About Eurus Energy America

Eurus Energy America is the wholly owned subsidiary of Tokyo-based Eurus Energy Holdings (www.eurusenergy.com) and is responsible for North and South American renewable energy investment, now comprising over 600 MW megawatts in wind and solar power generation. Eurus Energy Holdings is a global developer, owner and operator of renewable energy facilities, including both wind and solar, with more than 3,400 megawatts worldwide. Eurus Energy America, headquartered in San Diego, California, has been active in the renewable energy sector for some 30 years, beginning operations of its first renewable power projects in California in 1987.


Contacts

Eurus Energy America Corporation Contact:
Gilberto Garcia-Ruiz
This email address is being protected from spambots. You need JavaScript enabled to view it.
858-354-0928

CALGARY, Alberta--(BUSINESS WIRE)--Imperial Oil Limited (TSE: IMO, NYSE American: IMO) announced today that the Board of Directors, on the recommendation of a special committee of independent directors, has authorized the initiation of a substantial issuer bid (the “Offer”) pursuant to which the company will offer to purchase for cancellation up to $1,500,000,000 of its common shares (the “Shares”). The company anticipates that the terms and pricing will be determined, and the Offer will commence, during the next two weeks and will be completed before the end of December 2022. All amounts are in Canadian dollars.


Under the proposed issuer bid, which remains subject to obtaining the necessary exemptive relief under applicable securities laws in Canada and the United States, shareholders wishing to accept the Offer will have the opportunity to tender their Shares through a modified Dutch auction or through a proportionate tender which will result in them maintaining their proportionate Share ownership.

Exxon Mobil Corporation (“ExxonMobil”), Imperial’s majority shareholder, has advised Imperial that it intends to make a proportionate tender in connection with the Offer in order to maintain its proportionate Share ownership at approximately 69.6 percent following completion of the Offer.

The Offer referred to in this news release has not yet commenced. This news release is for informational purposes only and does not constitute an offer to buy or the solicitation of an offer to sell Shares. An offer to purchase the Shares will only be made pursuant to Offer documents to be filed with the applicable securities regulators in Canada and the United States, which remains subject to obtaining the necessary exemptive relief under applicable securities laws in Canada and the United States. The Offer will be optional for all shareholders, who will be free to choose whether to participate, how many Shares to tender and, in the case of auction tenders, at what price to tender within the specified range. Any shareholder who does not deposit any Shares (or whose Shares are not repurchased under the Offer) will realize a proportionate increase in equity interest in Imperial, to the extent that Shares are purchased under the Offer.

Imperial is one of Canada’s largest integrated oil companies. It is active in all phases of the petroleum industry in Canada, including the exploration for, and production and sale of, crude oil and natural gas. In Canada, it is a major producer of crude oil, the largest petroleum refiner and a leading marketer of petroleum products. It is also a major producer of petrochemicals. The company’s operations are conducted in three main segments: Upstream, Downstream and Chemical.

Cautionary statement: Statements of future events or conditions in this release, including projections, expectations and estimates are forward-looking statements. Forward-looking statements can be identified by words such as believe, anticipate, intend, propose, plan, expect, future, continue, likely, may, should, will and similar references to future periods. Forward-looking statements in this release include, but are not limited to, references to the aggregate amount of Shares to be purchased for cancellation under the Offer; the timing for determining the terms and pricing, commencement and expiration; the structure of the bid including a modified Dutch auction procedure and proportionate tender; and ExxonMobil’s intent to make a proportionate tender.

Forward-looking statements are based on the company's current expectations, estimates, projections and assumptions at the time the statements are made. Actual future financial and operating results, including expectations and assumptions concerning demand growth and energy source, supply and mix; commodity prices, foreign exchange rates and general market conditions; production rates, growth and mix; project plans, timing, costs, technical evaluations and capacities, and the company’s ability to effectively execute on these plans and operate its assets; that the necessary exemptive relief to proceed with the Offer under applicable securities laws in the United States and Canada will be received on the timeline anticipated; ExxonMobil making a proportionate tender in connection with the Offer; progression of COVID-19 and its impacts on Imperial’s ability to operate its assets; applicable laws and government policies, including restrictions in response to COVID-19; and capital and environmental expenditures could differ materially depending on a number of factors. These factors include global, regional or local changes in supply and demand for oil, natural gas, and petroleum and petrochemical products and resulting price, differential and margin impacts, including foreign government action with respect to supply levels and prices and the impact of COVID-19 on demand; the receipt, in a timely manner, of regulatory approvals; availability and allocation of capital; unanticipated technical or operational difficulties; operational hazards and risks; availability and performance of third-party service providers, including in light of restrictions related to COVID-19; management effectiveness and disaster response preparedness, including business continuity plans in response to COVID-19; currency exchange rates; political or regulatory events, including changes in law or government policy in response to COVID-19; general economic conditions; and other factors discussed in Item 1A risk factors and Item 7 management’s discussion and analysis of financial condition and results of operations of Imperial Oil Limited’s most recent annual report on Form 10-K and subsequent interim reports on Form 10-Q.

Forward-looking statements are not guarantees of future performance and involve a number of risks and uncertainties, some that are similar to other oil and gas companies and some that are unique to Imperial Oil Limited. Imperial’s actual results may differ materially from those expressed or implied by its forward-looking statements and readers are cautioned not to place undue reliance on them. Imperial undertakes no obligation to update any forward-looking statements contained herein, except as required by applicable law.

After more than a century, Imperial continues to be an industry leader in applying technology and innovation to responsibly develop Canada’s energy resources. As Canada’s largest petroleum refiner, a major producer of crude oil, a key petrochemical producer and a leading fuels marketer from coast to coast, our company remains committed to high standards across all areas of our business.

Source: Imperial


Contacts

Investor Relations Media Relations
(587) 476-4743 (587) 476-7010

NEW YORK--(BUSINESS WIRE)--New Fortress Energy Inc. (NASDAQ: NFE) (“NFE” or the “Company”) announced today that it has finalized its agreements with Comisión Federal de Electricidad (“CFE”) as part of a growing strategic alliance supported by His Excellency Andrés Manuel López Obrador, the President of Mexico, and by Manuel Bartlett, the CEO of CFE.


The final agreements, which were originally announced on July 5 and are expected to be executed at a ceremony planned for November 3 in Mexico City, involve (i) expanding and extending NFE’s supply of natural gas to multiple CFE power generation facilities in Baja California Sur, (ii) selling NFE’s 135 MW La Paz power plant to CFE, and (iii) creating a new FLNG hub off the coast of Altamira, Tamaulipas, with CFE supplying requisite feedgas to multiple NFE FLNG units using CFE’s existing and underutilized pipeline capacity.

“We are pleased to complete these agreements and expand our strategic alliance with CFE, which we expect to result in the delivery of our first FLNG unit by mid-2023 and enable the construction of a new LNG hub off the coast of Altamira,” said Wes Edens, Chairman and CEO of NFE. “I look forward to seeing President López Obrador next week, appreciate his continued support, and value the opportunity to demonstrate our commitment to producing cleaner, cheaper, and more reliable energy for Mexico and the world.”

Baja California Sur

In July 2021, NFE commenced commercial operations of an LNG regasification terminal in the port of Pichilingue, La Paz, Baja California Sur. The terminal, which features NFE’s proprietary ISOFlex system, is optimally positioned to supply natural gas to CFE’s generation facilities in the otherwise resource-stranded region, which include CTG La Paz and CTG Baja California Sur.

As part of the agreements, CFE and NFE will extend the term and increase the volume of NFE’s gas supply agreement to CFE’s power generation facilities in the region. Additionally, NFE will sell its own 135 MW Central Turbogás Amaunet power plant in La Paz to CFE, further enhancing NFE’s ability to internally fund strategic growth initiatives that service our customers’ needs amid a structurally short global LNG market.

The addition of this power plant to CFE’s generation fleet is expected to enhance system reliability, reduce power costs, and complement steps CFE is taking to expand the use of renewable energy resources and lower emissions in the region by nearly half a million tons of CO2 per year.

Altamira

NFE and CFE are collaborating on the creation of a new FLNG hub off the coast of Altamira, Tamaulipas.

Pursuant to the now finalized agreements, NFE will deploy multiple FLNG units of 1.4 MTPA each that utilize CFE’s existing firm pipeline transportation capacity on TC Energy’s Sur de Texas-Tuxpan Pipeline to deliver feedgas volumes to NFE.

NFE’s first FLNG unit, which is under construction at the Kiewit Offshore Services shipyard near Corpus Christi, Texas, is currently expected to achieve mechanical completion in March 2023, and will be delivered to Altamira for commencement of operations soon thereafter.

As part of the agreements, CFE would share in the production and marketing of a portion of the LNG volumes from the new Altamira offshore FLNG hub.

The transactions described in this press release are subject to customary terms and conditions and execution of the related agreements.

About New Fortress Energy

New Fortress Energy Inc. (NASDAQ: NFE) is a global energy infrastructure company founded to help address energy poverty and accelerate the world’s transition to reliable, affordable, and clean energy. The company owns and operates natural gas and liquefied natural gas (LNG) infrastructure, ships and logistics assets to rapidly deliver turnkey energy solutions to global markets. Collectively, the company’s assets and operations seek to support global energy security, enable economic growth, enhance environmental stewardship, and transform local industries and communities around the world.

Cautionary Language Regarding Forward-Looking Statements

This communication contains forward-looking statements. All statements contained in this communication other than historical information are forward-looking statements that involve known and unknown risks and relate to future events, our future financial performance or our projected business results. You can identify these forward-looking statements by the use of forward-looking words such as “expects,” “may,” “will,” “approximately,” “predicts,” “intends,” “plans,” “estimates,” “anticipates,” or the negative version of those words or other comparable words. Forward looking statements include: execution of definitive agreements for, and the consummation, of each of the three transactions described in this press release; achieving mechanical completion of NFE’s first FLNG unit in March 2023 and delivering the unit to the Altamira region for commencement of operations soon thereafter in mid-2023; the power plant assisting the CFE in achieving enhanced system reliability, reducing power costs and lowering C02 emissions; and expected terms of the definitive agreements for the transactions and projects. It is uncertain whether any of the events anticipated by the forward-looking statements will transpire or occur, or if any of them do, what impact they will have on the results of operations and financial condition of the parties or the stock prices of such parties.

These forward-looking statements represent the Company’s expectations or beliefs concerning future events, and it is possible that the results described in this press release will not be achieved. These forward-looking statements are necessarily estimates based upon current information and are subject to risks, uncertainties and other factors, many of which are outside of the Company’s control, that could cause actual results to differ materially from the results discussed in the forward-looking statements. Factors that could cause or contribute to such differences include, but are not limited to: the risk that the proposed transactions may not be completed in a timely manner or at all; risks related to the approval and execution of definitive documentation; risks related to the development, construction, completion or commissioning schedule for the facilities; the receipt of permits, approvals and authorizations from governmental and regulatory agencies on a timely basis or at all; unknown and unforeseen risks associated with the development of new technologies; risks related to liquefaction operations and production of natural gas and LNG; and the breach or failure by the parties to comply with the covenants and obligations under the related agreements. These factors are not necessarily all of the important factors that could cause actual results to differ materially from those expressed in any of NFE’s forward-looking statements. Other known or unpredictable factors could also have material adverse effects on future results.

Any forward-looking statement speaks only as of the date on which it is made, and, except as required by law, the Company does not undertake any obligation to update or revise any forward-looking statement, whether as a result of new information, future events or otherwise. New factors emerge from time to time, and it is not possible for the Company to predict all such factors. When considering these forward-looking statements, you should keep in mind the risk factors and other cautionary statements in our annual report, quarterly and other reports filed with the SEC, which could cause its actual results to differ materially from those contained in any forward-looking statement. We undertake no duty to update these forward-looking statements, even though our situation may change in the future.


Contacts

Investors
Patrick Hughes
This email address is being protected from spambots. You need JavaScript enabled to view it.

Media
Jake Suski
(516) 268-7403
This email address is being protected from spambots. You need JavaScript enabled to view it.

DUBLIN--(BUSINESS WIRE)--The "Global Helical Submerged Arc Welded (HSAW) Steel Pipe Market (2022 Edition) - Analysis By Diameter, Application, By Region, By Country: Market Insights and Forecast with Impact of COVID-19 (2022-2027)" report has been added to ResearchAndMarkets.com's offering.


The Global Helical Submerged Arc Welded (HSAW) Steel Pipe Market was valued at USD 5.42 Billion in the year 2021.

HSAW pipes are mainly used in onshore transportation of oil and gas, and in water distribution. These pipes are also used in structural applications such as piling in civil engineering constructions including high-rise buildings and bridges. However, improvement in manufacturing technology and steel grades over the years has extended its use to high-pressure applications.

Also, improvement in investments in oil and gas industry amidst the surge in energy consumption worldwide, and replacement demand for most of the antiquated pipeline infrastructure, particularly in developed regions offers potential growth prospects.

Based on the diameter, 24-48 inches of HSAW Steel Pipe is expected to hold the largest share in Helical Submerged Arc Welded (HSAW) Steel Pipe Market. This is due to the growth in construction sector and also growth in infrastructure development is expected to spur growth for this segment.

Asia Pacific had the highest Helical Submerged Arc Welded (HSAW) Steel Pipe demand in 2021 and it is expected to remain the largest consumer base for the next few years. High demand is attributable to the growing construction sector, infrastructural investments and government initiatives in various countries, including China and India.

Additionally, the HSAW pipe is part of the Large Diameter Pipes (LDPs) category, which is a key route of transport for natural gas, oil, and other fluids from isolated locations of production and refining to consuming centres across national and international boundaries.

Hence, the spending patterns for oil and gas transportation drive the demand for large diameter pipes. As a result, the business stands to benefit from the constant need to replace old pipelines, especially in developed economies like the United States and Europe.

Also, boosting demand for HSAW pipes in non-oil and gas applications is the expanding population and the resulting increase in demand for potable water and public infrastructure.

The companies analysed in the report include ArcelorMittal SA, American Cast Iron Pipe Company, Jindal SAW Ltd., Shengli Oil & Gas Pipe Holdings, Nippon Steel, Northwest Pipe Company, Welspun Corp Ltd., Europipe Gmbh, MAN Industries, National Pipe Company Ltd.

Scope of the Report

  • The report presents the analysis of Helical Submerged Arc Welded (HSAW) Steel Pipe market for the historical period of 2017-2021 and the forecast period of 2022-2027.
  • The Global Helical Submerged Arc Welded (HSAW) Steel Pipe Market has been analysed by countries (United States, Canada, Brazil, Germany, United Kingdom, Russia, China, Japan, India, Saudi Arabia).
  • Also, the attractiveness of the market has been presented by region, by Diameter, by Application.
  • Also, the major opportunities, trends, drivers and challenges of the industry has been analysed in the report.
  • The report tracks competitive developments, strategies, mergers and acquisitions and new product development.

Key Topics Covered:

1. Report Scope and Methodology

1.1 Scope of the Report

1.2 Research Methodology

1.3 Executive Summary

2. Strategic Recommendations

3. Global Helical Submerged Arc Welded (HSAW) Steel Pipe Market: Product Overview

4. Global Helical Submerged Arc Welded (HSAW) Steel Pipe Market: An Analysis

4.1 Global Helical Submerged Arc Welded (HSAW) Steel Pipe Market: Market Indicators

4.2 Market Size, By Value, 2017-2027

4.3 Market Size, By Volume, 2017-2027

4.4 Global Helical Submerged Arc Welded (HSAW) Steel Pipe Market: Growth and Forecast

4.5 Impact of COVID-19 on Global Helical Submerged Arc Welded (HSAW) Steel Pipe Market

5. Global Helical Submerged Arc Welded (HSAW) Steel Pipe Market: Segment Analysis

5.1 Global Helical Submerged Arc Welded (HSAW) Steel Pipe Market Segmentation, By Diameter

5.2 Competitive Positioning of Helical Submerged Arc Welded (HSAW) Steel Pipe Market: By Diameter (2021 & 2027)

5.3 By 18-24 inches, By Value (USD Billion), 2017-2027

5.4 By 24-48 inches, By Value (USD Billion), 2017-2027

5.5 By Above 48 inches, By Value (USD Billion), 2017-2027

6. Global Helical Submerged Arc Welded (HSAW) Steel Pipe Market: Segment Analysis

6.1 Global Helical Submerged Arc Welded (HSAW) Steel Pipe Market Segmentation, By Application

6.2 Competitive Positioning of Global Helical Submerged Arc Welded (HSAW) Steel Pipe Market, By Application (2021 & 2027)

6.3 By Water, By value (USD Billion), 2017-2027

6.4 By Construction, By Value (USD Billion), 2017-2027

6.5 By Oil & Gas, By value (USD Billion), 2017-2027

6.6 By Chemicals, By value (USD Billion), 2017-2027

6.7 By Others, By value (USD Billion), 2017-2027

7. Global Helical Submerged Arc Welded (HSAW) Steel Pipe Market: Regional Analysis

7.1 Competitive Positioning of Global Helical Submerged Arc Welded (HSAW) Steel Pipe Market: By Region (2021 & 2027)

8. Americas Helical Submerged Arc Welded (HSAW) Steel Pipe Market: An Analysis (2017-2027)

9. Europe Helical Submerged Arc Welded (HSAW) Steel Pipe Market: An Analysis (2017-2027)

10. Asia-Pacific Helical Submerged Arc Welded (HSAW) Steel Pipe Market: An Analysis (2017-2027)

11. Middle East and Africa Helical Submerged Arc Welded (HSAW) Steel Pipe Market: An Analysis (2017-2027)

12. Global Helical Submerged Arc Welded (HSAW) Steel Pipe Market Dynamics

12.1 Global Helical Submerged Arc Welded (HSAW) Steel Pipe Market Drivers

12.2 Global Helical Submerged Arc Welded (HSAW) Steel Pipe Market Restraints

12.3 Global Helical Submerged Arc Welded (HSAW) Steel Pipe Market Trends

13. Market Attractiveness and Strategic Analysis

13.1 Market Attractiveness Chart of Global Helical Submerged Arc Welded (HSAW) Steel Pipe Market - By Diameter (Year 2027)

13.2 Market Attractiveness Chart of Global Helical Submerged Arc Welded (HSAW) Steel Pipe Market - By Application (Year 2027)

13.3 Market Attractiveness Chart of Global Helical Submerged Arc Welded (HSAW) Steel Pipe Market - By Region (Year 2027)

14. Competitive Landscape

14.1 Recent Developments

14.2 Market Share of global leading companies

15. Company Profiles (Business Description, Financial Analysis, Business Strategy)

15.1 ArcelorMittal SA

15.2 American Cast Iron Pipe Company.

15.3 Jindal SAW Ltd.

15.4 Shengli Oil& Gas Pipe Holdings

15.5 Nippon Steel

15.6 Northwest Pipe Company

15.7 Welspun Corp Ltd

15.8 Europipe Gmbh

15.9 MAN Industries

15.10 National Pipe Company Ltd.

For more information about this report visit https://www.researchandmarkets.com/r/2l05jr


Contacts

ResearchAndMarkets.com
Laura Wood, Senior Press Manager
This email address is being protected from spambots. You need JavaScript enabled to view it.
For E.S.T Office Hours Call 1-917-300-0470
For U.S./ CAN Toll Free Call 1-800-526-8630
For GMT Office Hours Call +353-1-416-8900

CHICAGO--(BUSINESS WIRE)--$EXC--The Board of Directors of Exelon Corporation declared a regular quarterly dividend of $0.3375 per share on Exelon’s common stock. The dividend is payable on Friday, December 9, 2022, to Exelon’s shareholders of record as of 5 p.m. Eastern time on Tuesday, November 15, 2022.


About Exelon

Exelon (Nasdaq: EXC) is a Fortune 200 company and the nation’s largest energy delivery company, serving more than 10 million customers through six fully regulated transmission and distribution utilities — Atlantic City Electric (ACE), Baltimore Gas and Electric (BGE), Commonwealth Edison (ComEd), Delmarva Power & Light (DPL), PECO Energy Company (PECO), and Potomac Electric Power Company (Pepco). More than 18,000 Exelon employees dedicate their time and expertise to powering a cleaner and brighter future for our customers and communities through reliable, affordable and efficient energy delivery, workforce development, equity, economic development and volunteerism. Follow Exelon on Twitter @Exelon.


Contacts

Andrew Plenge
Investor Relations
This email address is being protected from spambots. You need JavaScript enabled to view it.

Nick Alexopulos
Corporate Communications
This email address is being protected from spambots. You need JavaScript enabled to view it.

Positive net income, revenue growth and significant margin expansion define a successful quarter.

HOUSTON--(BUSINESS WIRE)--Ranger Energy Services, Inc. (NYSE: RNGR) (“Ranger” or the “Company”) announced today its results for its fiscal quarter ended September 30, 2022.


– Revenue for the third quarter of 2022 was $177.0 million, an increase of $23.4 million, or 15%, from $153.6 million in the prior quarter and an increase of over 100% from the prior year.

– Net income for the third quarter was $13.6 million, an improvement of $14.0 million from a reported net loss of $0.4 million in the second quarter of the year and an increase of $22.7 million, or 250%, from the third quarter of 2021.

– Adjusted EBITDA(1) of $30.3 million increased 69%, or $12.3 million from the $18.0 million reported in the second quarter driven by increased activity and expanding margins across all segments.

– Net debt was reduced by 19%, or $13.2 million, from the prior quarter with operating cash flow of $10.7 million for the third quarter.

– Wireline Services Adjusted EBITDA of $11.4 million, growth of $7.1 million, or 165%, from $4.3 million reported in the prior quarter as a result of increased pricing and successful internal initiatives.

CEO Comments

Stuart Bodden, the Company’s Chief Executive Officer, noted “Ranger delivered another quarter of strong performance, with all three of our business segments showing increased revenue and expanded margins during the quarter. On a consolidated basis, revenue increased 15% quarter over quarter, while Adjusted EBITDA grew 69%. Adjusted EBITDA margins exceeded 17% achieving our stated goal of a 15% margin run rate by year end. Our strong performance is the direct result of the hard work of our teams and our continued focus on customer service and disciplined execution. After a year of integration efforts, our leadership is aligning behind our shared objectives and continuing to find incremental efficiencies and opportunities. All of our acquisitions executed last year are now delivering strong returns demonstrating the value of our consolidation strategy. In consideration of our outstanding Q3 performance, we now expect revenue to range between $615 and $620 million for the full year with Adjusted EBITDA margins near the top end of prior guidance of 13%.

Mr. Bodden continued, “We have high standards for Ranger and are continuing to raise our expectations for the company. We have performed well, matured as an organization and improved our financial health on the back of the acquisitions completed during 2021, with teams that believe we can and will take advantage of additional opportunities to improve further. The best illustration of outstanding performance is acknowledgment from a customer and we are proud that this quarter one of our crews received “Rig of the Quarter” from Pioneer Natural Resources in the Permian region. We are proud of this rig crew and local management for operating with the excellence that earned them this recognition.

“As we look to the future, we understand our shareholders expect the business to continue its strong performance and pursue opportunities to maximize the long-term value of the Company. This quarter, Management and the Board have revisited our strategic priorities, which first and foremost, includes ensuring the Company has a resilient balance sheet that can withstand virtually any storm. The other strategic priority is growth, whether organic or inorganic, which is important for a company of our size operating in a fragmented sector. Our financial results have demonstrated our ability to successfully integrate companies and be an effective consolidator, and we believe there is a need for further consolidation within our existing and adjacent product lines. Going forward, we will continue to evaluate these priorities in keeping with our goal to maximize shareholder value.”

Consolidated Company Results

Company revenue increased to $177.0 million in the third quarter of 2022, up from $153.6 million in the second quarter and up from $81.7 million in the third quarter of the prior year. Asset utilization and pricing increases both contributed to the improved revenue across segments.

Operating expense for the third quarter totaled $159.0 million as compared to $155.8 million for the prior quarter. The increase in operating costs were largely a result of an increase in operating activity for the quarter.

The Company is reporting a net income of $13.6 million, an increase of $14.0 million, for the third quarter compared to a $0.4 million loss in the second quarter of the year. The increase is attributable to increased profit margins across all of the reporting segments.

General and administrative costs were $11.0 million for the third quarter, a decrease of $1.2 million from $12.2 million during the second quarter. The decrease was predominately from less integration, severance, and legal costs as compared to the prior quarter.

Adjustments to EBITDA at a consolidated level were affected by several non-cash items this quarter that included asset sale impacts, bargain purchase gain and severance and reorganization costs.

Our key financial focus in the coming quarters will be on making incremental improvements to operating efficiency to facilitate additional margin expansion and improve cash flows that will be deployed toward paying down our debt. Current internal projections suggest the fourth quarter of the year will bring about seasonality leading to moderate declines in financial performance that is likely to continue into the first quarter. We anticipate a meaningful pickup in activity again as we exit the first quarter of 2023. The Company is using the second half of 2022 as a 2023 budget baseline and does believe that there are additional opportunities to grow from these levels. Budgeting discussions have been initiated and the Company will provide further guidance when year end results are reported.

Business Segment Financial Results

High Specification Rigs

High Specification Rigs segment revenue increased by $3.7 million to $79.7 million in the third quarter from $76.0 million in the second quarter. Rig hours increased to 123,000 hours in the third quarter from 119,900 hours in the second quarter of the year. The increase in rig hours was coupled with an increase of $16, or 3%, in the hourly average rig rate to $648 in the third quarter from $632 in the second quarter, driving an overall revenue increase of 5%.

Operating income increased by $4.6 million to $10.7 million in the third quarter from $6.1 million in the second quarter. Adjusted EBITDA increased 20%, or $2.8 million, to $17.0 million in the third quarter from $14.2 million in the second quarter. The increase in operating income and Adjusted EBITDA was largely the result of the increases in profit margins during the quarter due to declining operating expenses as compared to the second quarter.

Wireline Services

Wireline Services segment revenue increased to $60.6 million, up $11.1 million, or 22% in the third quarter from $49.5 million in the second quarter. The increase in revenue was primarily attributable to an increase in activity, as demonstrated by an increase in 1,200 completed stages from 8,000 in the second quarter to 9,200 in the third quarter.

Operating income increased to $8.6 million, up $7.1 million, or over 400% in the third quarter, up from $1.5 million in the second quarter. Adjusted EBITDA increased $7.1 million to $11.4 million in the third quarter, up from $4.3 million in the second quarter. The increase in operating income and Adjusted EBITDA was driven by both increased activity for all Wireline Services and expanding profit margins, attributable to several efforts implemented earlier in the year. We believe we will continue to see further improvements in this segment during 2023.

Processing Solutions and Ancillary Services

Processing Solutions and Ancillary Services segment revenue increased by 30%, or $8.6 million, to $36.7 million in the third quarter from $28.1 million in the second quarter. The increase in revenue was attributable to the various lines of business including coil tubing, rentals and fishing and plug and abandonment services, which continued to show meaningful growth and margin expansion this quarter.

Operating income increased $4.1 million to $9.2 million in the third quarter, up from $5.1 million in the second quarter of the year. Adjusted EBITDA increased 106%, or $5.4 million, to $10.5 million in the third quarter, as compared to $5.1 million in the second quarter of the year. The increase in operating income and Adjusted EBITDA was driven by increased margins on improvements in revenue.

Balance Sheet Summary

We ended the third quarter with $35.7 million of liquidity, consisting of $30.5 million of capacity on our revolving credit facility and $5.2 million of cash.

Our aggregate net debt at the end of the third quarter was $57.5 million, a decrease of $13.2 million, as compared to $70.7 million at the end of the second quarter. The decrease is attributable to additional payments on our revolving credit facility, coupled with the extinguishment of Term Loan B and payments made to term debt with proceeds from asset sales.

Our net debt includes certain financing arrangements which we adjust for comparability. When looking at aggregate adjusted net debt(1), we ended the third quarter at $45.2 million, a decrease of $13.1 million, as compared to $58.3 million at the end of the second quarter. Of our total debt balance, $18.0 million is term debt.

We had an outstanding balance on our revolving credit facility of $24.9 million at the end of the third quarter compared to $33.9 million at the end of the second quarter.

The Company continues to anticipate capital expenditures of approximately $15.0 million for the full year of 2022.

Conference Call

The Company will host a conference call to discuss its results from the third quarter of 2022 on October 28, 2022 at 9:00 a.m. Central Time (10:00 a.m. Eastern Time). To join the conference call participants are encouraged to login to the webcast via this link.

An audio replay of the conference call will be available shortly after the conclusion of the call and will remain available for approximately seven days. The replay will also be available in the Investor Resources section of the Company’s website shortly after the conclusion of the call and will remain available for approximately seven days.

About Ranger Energy Services, Inc.

Ranger is one of the largest providers of high specification mobile rig well services, cased hole wireline services, and ancillary services in the U.S. oil and gas industry. Our services facilitate operations throughout the lifecycle of a well, including the completion, production, maintenance, intervention, workover and abandonment phases.

Cautionary Statement Concerning Forward-Looking Statements

Certain statements contained in this press release constitute “forward-looking statements” within the meaning of Section 27A of the Securities Act of 1933 and Section 21E of the Securities Exchange Act of 1934. These forward-looking statements represent Ranger’s expectations or beliefs concerning future events, and it is possible that the results described in this press release will not be achieved. These forward-looking statements are subject to risks, uncertainties and other factors, many of which are outside of Ranger’s control that could cause actual results to differ materially from the results discussed in the forward-looking statements.

Any forward-looking statement speaks only as of the date on which it is made, and, except as required by law, Ranger does not undertake any obligation to update or revise any forward-looking statement, whether as a result of new information, future events or otherwise. New factors emerge from time to time, and it is not possible for Ranger to predict all such factors. When considering these forward-looking statements, you should keep in mind the risk factors and other cautionary statements in our filings with the Securities and Exchange Commission. The risk factors and other factors noted in Ranger’s filings with the SEC could cause its actual results to differ materially from those contained in any forward-looking statement.


(1)

“Adjusted EBITDA” and “Adjusted Net Debt” are not presented in accordance with generally accepted accounting principles in the United States (“U.S. GAAP”). A Non-GAAP supporting schedule is included with the statements and schedules attached to this press release and can also be found on the Company's website at: www.rangerenergy.com.

RANGER ENERGY SERVICES, INC.

UNAUDITED CONDENSED CONSOLIDATED STATEMENTS OF OPERATIONS

(in millions, except share and per share amounts)


Three Months Ended


September 30, 2022


June 30, 2022

Revenue


High specification rigs


$

79.7


$

76.0


Wireline services


60.6


49.5


Processing solutions and ancillary services


36.7


28.1


Total revenue


177.0


153.6


Operating expenses


Cost of services (exclusive of depreciation and amortization):


High specification rigs


62.7


61.8


Wireline services


49.2


45.2


Processing solutions and ancillary services


26.2


23.0


Total cost of services


138.1


130.0


General and administrative


11.0


12.2


Depreciation and amortization


10.8


11.4


Impairment of fixed assets


0.2


1.1


Gain (loss) on sale of assets


(1.1

)


1.1


Total operating expenses


159.0


155.8


Operating income (loss)


18.0


(2.2

)


Other (income) expenses


Interest expense, net


1.8


1.8


Gain on bargain purchase, net of tax


(0.8

)


(2.8

)

Total other (income) expenses, net


1.0


(1.0

)


Income (loss) before income tax benefit


17.0


(1.2

)

Tax (benefit) expense


3.4


(0.8

)

Net income (loss)


$

13.6


$

(0.4

)


Income (loss) per common share:


Basic


$

0.55


$

(0.02

)

Diluted


$

0.54


$

(0.02

)

Weighted average common shares outstanding


Basic


24,845,517


23,581,466


Diluted


25,184,067


23,581,466


RANGER ENERGY SERVICES, INC.

UNAUDITED CONDENSED CONSOLIDATED BALANCE SHEETS

(in millions, except share and per share amounts)


September 30, 2022


December 31, 2021

Assets


Cash and cash equivalents


$

5.2


$

0.6


Accounts receivable, net


95.0


80.8


Contract assets


38.7


13.0


Inventory


5.4


2.5


Prepaid expenses


12.6


8.3


Assets held for sale


5.1


Total current assets


162.0


105.2


Property and equipment, net


226.2


270.6


Intangible assets, net


7.2


7.8


Operating leases, right-of-use assets


11.6


6.8


Other assets


1.2


2.7


Total assets


$

408.2


$

393.1


Liabilities and Stockholders' Equity


Accounts payable


36.7


20.7


Accrued expenses


34.0


30.3


Other financing liability, current portion


0.8


2.2


Long-term debt, current portion


30.4


44.1


Other current liabilities


6.1


5.4


Total current liabilities


108.0


102.7


Operating leases, right-of-use obligations


10.1


5.8


Other financing liability


11.8


12.5


Long-term debt, net


12.9


18.4


Other long-term liabilities


7.7


5.0


Total liabilities


$

150.5


$

144.4


Commitments and contingencies


Stockholders' equity


Preferred stock, $0.01 per share; 50,000,000 shares authorized; no shares issued and outstanding as of September 30, 2022; 6,000,001 shares issued and outstanding as of December 31, 2021


0.1


Class A Common Stock, $0.01 par value, 100,000,000 shares authorized; 25,425,754 shares issued and 24,873,926 shares outstanding as of September 30, 2022; 18,981,172 shares issued and 18,429,344 shares outstanding as of December 31, 2021


0.3


0.2


Class B Common Stock, $0.01 par value, 100,000,000 shares authorized; no shares issued or outstanding as of September 30, 2022 and December 31, 2021


Less: Class A Common Stock held in treasury at cost; 551,828 treasury shares as of September 30, 2022 and December 31, 2021


(3.8

)


(3.8

)

Accumulated deficit


(0.5

)


(8.0

)

Additional paid-in capital


261.7


260.2


Total controlling stockholders' equity


257.7


248.7


Total liabilities and stockholders' equity


$

408.2


$

393.1


RANGER ENERGY SERVICES, INC.

UNAUDITED CONDENSED CONSOLIDATED STATEMENT OF CASH FLOWS

(in millions)


Nine Months Ended


September 30, 2022

Cash Flows from Operating Activities


Net income


$

7.5


Adjustments to reconcile net income to net cash provided by operating activities:


Depreciation and amortization


33.8


Equity based compensation


2.8


Impairment of fixed assets


1.3


Gain on bargain purchase, net of tax


(3.6

)

Other expense, net


0.9


Changes in operating assets and liabilities, net effects of business acquisitions


Accounts receivable


(14.3

)

Contract assets


(25.7

)

Inventory


(2.9

)

Prepaid expenses and other current assets


(4.2

)

Other assets


(3.6

)

Accounts payable


16.0


Accrued expenses


3.7


Other current liabilities


0.8


Other long-term liabilities


6.0


Net cash provided by operating activities


18.5


Cash Flows from Investing Activities


Purchase of property and equipment


(8.7

)

Proceeds from disposal of property and equipment


20.4


Purchase of businesses, net of cash received


0.8


Net cash provided by investing activities


12.5


Cash Flows from Financing Activities


Borrowings under Credit Facility


431.0


Principal payments on Credit Facility


(433.2

)

Principal payments on Eclipse M&E Term Loan


(1.5

)

Principal payments under Eclipse Term Loan B


(12.4

)

Principal payments on Secured Promissory Note


(3.3

)

Principal payments on financing lease obligations


(3.4

)

Principal payments on other financing liabilities


(2.2

)

Shares withheld on equity transactions


(1.1

)

Payments on Installment Purchases


(0.3

)

Net cash used in financing activities


(26.4

)


Increase in cash and cash equivalents


4.6


Cash and cash equivalents, Beginning of Period


0.6


Cash and cash equivalents, End of Period


$

5.2


Supplemental Cash Flow Information


Interest paid


$

0.8


Supplemental Disclosure of Non-cash Investing and Financing Activities


Capital expenditures


$

(0.7

)

Additions to fixed assets through installment purchases and financing leases


$

(3.5

)


RANGER ENERGY SERVICES, INC.

SUPPLEMENTAL NON-GAAP FINANCIAL MEASURES

(UNAUDITED)

Note Regarding Non‑GAAP Financial Measure

The Company utilizes certain non-GAAP financial measures that management believes to be insightful in understanding the Company’s financial results. These financial measures, which include Adjusted EBITDA and Adjusted Net Debt, should not be construed as being more important than, or as an alternative for, comparable U.S. GAAP financial measures. Detailed reconciliations of these Non-GAAP financial measures to comparable U.S. GAAP financial measures have been included below and are available in the Investor Relations sections of our website at www.rangerenergy.com. Our presentation of Adjusted EBITDA and Adjusted Net Debt should not be construed as an indication that our results will be unaffected by the items excluded from the reconciliations. Our computations of these Non-GAAP financial measures may not be identical to other similarly titled measures of other companies.

Adjusted EBITDA

We believe Adjusted EBITDA is a useful performance measure because it allows for an effective evaluation of our operating performance when compared to our peers, without regard to our financing methods or capital structure. We exclude the items listed above from net income or loss in arriving at Adjusted EBITDA because these amounts can vary substantially within our industry depending upon accounting methods, book values of assets, capital structures and the method by which the assets were acquired. Certain items excluded from Adjusted EBITDA are significant components in understanding and assessing a company’s financial performance, such as a company’s cost of capital and tax structure, as well as the historic costs of depreciable assets, none of which are reflected in Adjusted EBITDA.

We define Adjusted EBITDA as net income or loss before net interest expense, income tax provision or benefit, depreciation and amortization, equity‑based compensation, acquisition-related, severance and reorganization costs, gain or loss on disposal of assets, and certain other non-cash and certain items that we do not view as indicative of our ongoing performance.

The following tables are a reconciliation of net income or loss to Adjusted EBITDA for the three months ended September 30, 2022 and June 30, 2022, in millions:


Three Months Ended September 30, 2022


High

Specification Rigs


Wireline

Services


Processing

Solutions

and

Ancillary

Services


Other


Total


(in millions)

Net income (loss)


$

10.7


$

8.6


$

9.2


$

(14.9

)


$

13.6


Interest expense, net


1.8


1.8


Tax (benefit) expense


3.4


3.4


Depreciation and amortization


6.3


2.8


1.3


0.4


10.8


Impairment of fixed assets


0.2


0.2


EBITDA


17.0


11.4


10.5


(9.1

)


29.8


Equity based compensation


1.1


1.1


(Gain) loss on disposal of property and equipment


(1.1

)


(1.1

)

Bargain purchase gain, net of tax


(0.8

)


(0.8

)

Severance and reorganization costs


1.1


1.1


Acquisition related costs


Legal fees and settlements


0.2


0.2


Adjusted EBITDA


$

17.0


$

11.4


$

10.5


$

(8.6

)


$

30.3


Three Months Ended June 30, 2022


High

Specification

Rigs


Wireline

Services


Processing

Solutions and

Ancillary

Services


Other


Total


(in millions)

Net income (loss)


$

6.1


$

1.5


$

5.1


$

(13.1

)


$

(0.4

)

Interest expense, net


1.8


1.8


Tax (benefit) expense


(0.8

)


(0.8

)

Depreciation and amortization


8.1


2.8


0.5


11.4


Impairment of fixed asset


1.1


1.1


EBITDA


14.2


4.3


5.1


(10.5

)


13.1


Equity based compensation


0.9


0.9


(Gain) loss on disposal of property and equipment


2.1


2.1


Bargain purchase gain, net of tax


(2.8

)


(2.8

)

Severance and reorganization costs


0.5


0.5


Acquisition related costs


3.3


3.3


Legal fees and settlements


0.9


0.9


Adjusted EBITDA


$

14.2


$

4.3


$

5.1


$

(5.6

)


$

18.0


Adjusted Net Debt

We believe Net Debt and Adjusted Net Debt are useful performance measures of liquidity, financial health and provides an indication of our leverage. We define Net Debt as current and long-term debt, finance leases, other financing obligations, offset by cash and cash equivalents. We define Adjusted Net Debt as Net Debt, less a facility financing lease, to be analogous to the calculation of certain financial covenants. All debt and other obligations present the principal balances outstanding as of the respective periods.

The following tables are a reconciliation of consolidated debt and cash and cash equivalents to Net Debt and Adjusted Net Debt as of September 30, 2022 and June 30, 2022:


September 30, 2022


June 30, 2022


Change


(in millions)

Debt and Other Obligations


Credit facility


$

24.9


$

33.9


$

(9.0

)

Eclipse Term Loan A


11.0


11.7


(0.7

)

Eclipse Term Loan B


2.8


(2.8

)

Secured Promissory Note


7.0


7.7


(0.7

)

Installment purchases


0.6


0.7


(0.1

)

Other financing liabilities


12.6


12.8


(0.2

)

Finance lease obligations


6.6


6.2


0.4


Less: Cash and cash equivalents


5.2


5.1


0.1


Net Debt


57.5


70.7


(13.2

)

Less: Facility financing lease


12.3


12.4


(0.1

)

Adjusted Net Debt


$

45.2


$

58.3


$

(13.1

)


Contacts

Company Contact:
Melissa Cougle
Chief Financial Officer
(713) 935-8900
This email address is being protected from spambots. You need JavaScript enabled to view it.


Read full story here

DUBLIN--(BUSINESS WIRE)--The "Anaerobic Digestion Deployment in the UK 2022 Edition" report has been added to ResearchAndMarkets.com's offering.


The reassuring vibrancy of the industry is evident post COVID-19. Although there hasn't been any significant leap in deployment, the publisher continues to see a steady rise in activity which is required in order to deliver and maintain a strong, healthy and resilient sector.

The report provides a comprehensive regional breakdown of sector development in Scotland, Wales, Northern Ireland and the 9 regions of England, providing detailed information on feedstock requirements, installed capacity and output type (combined heat & power or biomethane-to-grid) for every project.

This 2022 edition of the annual report provides a comprehensive regional breakdown of sector development in Scotland, Wales, Northern Ireland and the 9 regions of England.

Highlights

  • Extensive market data and analysis on current and future development trends
  • Regional breakdown of the 9 regions of England, Scotland, Wales, and Northern Ireland, with maps and timeline graphs illustrating regional development trends.
  • Detailed sector commentary and comprehensive overview of policy and incentives affecting the anaerobic digestion development landscape.
  • Comprehensive excel database of more than 1000 planned and operational Anaerobic Digestion facilities in the UK.
  • Includes site name and location; feedstock type, source and volumes; energy output type and capacity; and development status.

Reasons to buy

  • To inform investment and policy decisions in the anaerobic digestion sector by understanding the current and future anaerobic digestion market and policy landscape
  • To enable targeting of sales and marketing effort for anaerobic digestion service and product providers, based on technical or regional focus.
  • To identify the competition and quantify feedstock requirements of the anaerobic digestion industry

Key Topics Covered:

1 Introduction

2 Policy & Incentives

2.1 Smart Export Guarantee (SEG)

2.2 Contracts for Difference

2.3 Northern Ireland Renewables Obligation

2.4 Renewable Heat Incentive

2.5 Green Gas Support Scheme

2.6 Northern Ireland Renewable Heat Incentive

2.7 Sustainability Criteria

2.8 Feedstock Restrictions

2.9 Renewable Transport Fuel Obligation

3 Deployment Analysis Criteria

3.1 Definitions

3.2 Assumptions

4 United Kingdom

5 Scotland

6 Wales

7 Northern Ireland

8 England

9 North West of England

10 North East of England

11 Yorkshire & Humber

12 West Midlands

13 East Midlands

14 East of England

15 South West of England

16 South East of England

17 Greater London

For more information about this report visit https://www.researchandmarkets.com/r/3vqs35


Contacts

ResearchAndMarkets.com
Laura Wood, Senior Press Manager
This email address is being protected from spambots. You need JavaScript enabled to view it.

For E.S.T Office Hours Call 1-917-300-0470
For U.S./ CAN Toll Free Call 1-800-526-8630
For GMT Office Hours Call +353-1-416-8900

Offshore Source Logo

Offshore Source keeps you updated with relevant information concerning the Offshore Energy Sector.

Any views or opinions represented on this website belong solely to the author and do not represent those of the people, institutions or organizations that Offshore Source or collaborators may or may not have been associated with in a professional or personal capacity, unless explicitly stated.

Corporate Offices

Technology Systems Corporation
8502 SW Kansas Ave
Stuart, FL 34997

info@tscpublishing.com