Business Wire News

Convergent’s AI-powered battery storage solution helps reduce energy costs for Ford while improving long-term sustainability of Ontario’s grid

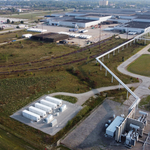
WINDSOR, Ontario & NEW YORK--(BUSINESS WIRE)--The same lithium-ion battery technology propelling electric vehicles is being used to cost-effectively power a portion of the Ford Motor Company’s (Ford) Essex Engine Plant in Windsor, Ontario during peak power consumption periods. Convergent Energy and Power (Convergent), a leading provider of energy storage solutions in North America, was chosen to help support Ford’s power needs at the plant with a 4 MW / 8MWh battery energy storage system (BESS), which is currently in operation.


Historically, industrial electricity costs in Ontario have been higher than in any other Canadian province. Because energy is often most expensive—and most carbon-intensive—when it is in the greatest demand, businesses are incentivized to reduce their energy usage during peak times. At the Essex Engine Plant, Convergent’s AI-powered energy storage system strategically reduces the facility’s electricity consumption, reducing its costs and carbon footprint while supporting the long-term sustainability of the grid.

“The battery storage system provided by Convergent Energy and Power is a strong example of how batteries can support the auto industry at the plant level while also supporting the electric grid serving Ford and the surrounding community,” said Thomas Reeber, Plant Manager at the Ford Essex Plant.

“With our friends at Ford’s Essex Engine Plant, we’ve proven that our battery energy storage systems can lower commercial and industrial facilities’ utility bills,” said Johannes Rittershausen, CEO of Convergent Energy and Power. “Convergent has over a decade of expertise developing and operating energy storage solutions that are a win for our customers and the clean energy transition.”

Convergent’s battery energy storage system at the Essex Engine Plant is one of the first for Ford Motor Co.

About Convergent Energy and Power
Convergent Energy and Power (Convergent) is a leading provider of energy storage solutions in North America. Convergent has over a decade of experience financing and managing all aspects of the energy storage development cycle to help customers reduce electricity costs and increase reliability. The company’s commercial, industrial, and utility-scale assets can yield seven-figure savings while advancing the clean energy transition. Convergent’s proprietary asset management platform, PEAK IQ® leverages machine learning and deep market knowledge to optimize asset performance and maximize value. Convergent has over $500M invested in or committed to projects in operation or under development across North America. For more information, visit convergentep.com or follow us on LinkedIn or Twitter.


Contacts

Convergent Press Contact
Kate Siskel
SVP, Marketing and Communications
Convergent Energy and Power
This email address is being protected from spambots. You need JavaScript enabled to view it.
917-508-0274

THE WOODLANDS, Texas--(BUSINESS WIRE)--AEGIS Hedging Solutions ("AEGIS" or “the Company"), a leader in technology and expertise for commodity and environmental markets, today announced the appointment of Zander Capozzola to the newly created position of Vice President of Renewable Fuels. With over 15 years of experience in environmental markets price reporting, analysis and consulting, Capozzola will be responsible for leading AEGIS’ continued growth in the fast-moving biofuels and renewable fuels markets.


Interest and investment in renewable fuels, including renewable natural gas, renewable diesel, and sustainable aviation fuel, continue to increase. The Renewable Fuel Standard (RFS) and various Low Carbon Fuel Standards (LCFS) markets have provided attractive economics to many projects over the years, but the extreme volatility of the Renewable Identification Numbers (RINs) and LCFS markets has caused challenges for project developers. AEGIS assists developers and investors with understanding the value of the fuels, their environmental attributes and regulations driving the marketplace – and how to place hedges to increase financial certainty.

"Since our acquisition of Emission Advisors last year, AEGIS has introduced many new capabilities in the environmental markets to support our customers. Zander’s experience with renewable fuels, feedstocks, and the related environmental credits will serve our customers well as they pursue emerging opportunities in the renewables space," said Bryan Sansbury, Chairman and CEO of AEGIS.

Capozzola joins AEGIS from Argus, where he spent the last decade covering Renewable Volume Obligation (RVO), RINs, Tier-3 sulfur credits, sustainable aviation fuel (SAF) and renewable diesel from the premier price-reporting agency in biofuels and related markets. Capozzola will serve under the leadership of Mike Taylor, who leads environmental efforts at AEGIS.

"AEGIS has changed the way companies navigate and manage commodity and compliance markets – even changing how we view risk," said Capozzola. "AEGIS is in an enviable market-leading position with customers, modern technology, proprietary analytics and talented colleagues in an unmatched culture. As a result, our customers place tremendous trust in us, and I look forward to tailoring our capabilities to meet their unique needs in both nascent and more mature markets."

If you are interested in learning more about the biofuels and renewable fuels markets, please contact our team by visiting www.aegis-hedging.com.

About AEGIS

AEGIS simplifies commodity and environmental markets for companies serious about managing their commodity exposures and/or emission footprints. AEGIS has unmatched technology and expertise to deliver market insights, tailored hedge strategies, efficient trade execution, and full-cycle management of hedge positions – all designed for regulatory compliance. Building on its core energy hedging capabilities, AEGIS has recently completed four acquisitions to extend its expertise in environmental and metals markets, increase its analytics capabilities and fully-integrate a SaaS E/CTRM software platform. AEGIS was recently named the industry leader in hedging solutions for an unprecedented fifth consecutive year. AEGIS is headquartered in The Woodlands, Texas. To learn more, visit AEGIS’ website at www.aegis-hedging.com.


Contacts

Lauren Trice
This email address is being protected from spambots. You need JavaScript enabled to view it.
346.277.0971

SYDNEY & NEW YORK & SAN FRANCISCO--(BUSINESS WIRE)--Xpansiv, the premier market-infrastructure platform for environmental commodities, today announced the launch of a new benchmark carbon-offset contract, Sustainable Development Global Emissions Offset (SD-GEO).

The standardized contract, tradable on Xpansiv market CBL, provides a benchmark for market participants and corporates to transact high-quality carbon offsets from projects that also deliver high social impact. The SD-GEO will allow for delivery of cookstove projects with a minimum of five Sustainable Development Goals (SDGs) from the Verra or Gold Standard registries.

Eligible projects are carefully vetted under the CBL Standard Instruments Program that contains the Global Emissions Offset (GEO®), the first in this series developed by Xpansiv, as well as the Nature-Based Global Emissions Offset (N-GEO®), “widely seen as the frontrunner to become the VCM’s biggest price benchmark,” according to Quantum Commodity Intelligence.

“Corporates often look for offset projects that mitigate emissions while also having co-benefits for local communities—projects like clean cookstoves,” said Russell Karas, Xpansiv Head of Carbon Market Development. “This emerging segment of the carbon market will grow exponentially in the coming years, and Xpansiv offers a better way to price and trade these high-quality credits.”

“The concept of co-benefits is not new to CBL’s standardized offset contracts,” said Xpansiv Chief Commercial Officer Ben Stuart. “The N-GEO, for example, also requires a Climate, Community, and Biodiversity accreditation from Verra. The SD-GEO is the next contract in the GEO series that will bring transparency, price certainty, and a simplified selection process to a vital subset of the offset market—another important step toward a carbon-neutral future.”

“Clean cookstove projects deliver significant sustainable development impact, with our high-quality projects reaching 9–11 SDGs, bringing permanent and measurable improvements to the rural poor,” said Chen Yang, Chief Commercial Officer, C-Quest Capital (CQC). “As one of the leading clean cookstove project developers, we welcome Xpansiv’s initiative, setting a core impact benchmark for this project type and establishing a robust market that will support the future of clean cookstove projects.”

Erik Petersson, Head of Macquarie’s Global Carbon business—an Xpansiv investor and co-marketer of carbon offsets from a suite of CQC cookstove projects—called the launch of the SD-GEO contract a “pivotal moment” in simplifying the path to net zero. “With this contract, organizations can gain transparent, direct market access to high-quality ‘social carbon’ based on standardized metrics while supporting truly impactful projects in these communities,” said Petersson. “We’re excited to support the SD-GEO launch and the opportunities it provides to expand what we can offer our clients more broadly.”

Xpansiv reports the SD-GEO will begin trading on 5 December. The announcement follows ​the launch​ of​ ESGclear​ from Xpansiv ​company APX, the leading registry and ledger provider for environmental markets​. ESGclear provides unprecedented transparency for transactions that require ESG reporting, financing, and mitigation across supply chains.

About Xpansiv

Xpansiv provides the market infrastructure and data platform for carbon, renewable, and digital-energy commodities. These Intelligent Commodities bring transparency and liquidity to markets, empowering participants to value energy, carbon, and water to meet the challenges of an information-rich, resource-constrained world. The company’s main business units include CBL, the largest spot exchange for ESG commodities, including carbon, renewable energy certificates, and Digital Natural Gas; H2OX, the leading spot exchange for water; XSignals, which provides end-of-day and historical market data; EMA, the leading multi-registry portfolio management system for all environmental commodities; and APX, the leading provider of registry infrastructure for energy and environmental markets. Xpansiv is the digital nexus where sustainability and price signals merge. Xpansiv.com

About C-Quest Capital

C-Quest Capital (CQC) is a world-leading carbon project developer whose purpose is to transform the lives of low-income rural families whose health, well-being, and economic welfare are most at risk from climate change. CQC does this by providing access to clean energy technologies and sustainable land-use solutions that reduce greenhouse gas emissions, combat global climate change, and improve the lives of those in need. CQC was recently awarded “Best Project Developer: Energy Efficiency” and runner-up for “Best Project Developer: Public health” in Environmental Finance’s Voluntary Carbon Market Rankings 2022.

CQC was founded in 2008 and is headquartered in Washington D.C., USA, with subsidiaries in India, Malaysia, Singapore, Cambodia, and Australia and field teams across the countries we operate in. CQC has carbon project operations in over 17 countries across Sub-Saharan Africa, Central America, and South and Southeast Asia. CQC’s Transformation Carbon projects have already reduced CO2 e emissions by 14.62 million tonnes and improved the lives of over 20 million people.

About Macquarie Global Carbon

The “Global Carbon” division of the Commodities and Global Markets group builds on Macquarie’s group-wide energy transition activity and is a continuation of the Group’s 15-year involvement in physical and financial aspects of carbon and environmental product markets around the world. The business provides integrated carbon offsetting solutions across the entire offset lifecycle from generation through to retirement, providing clients with greater access to voluntary and compliance carbon offsets as well as originating, structuring and bringing capital to carbon removal and reduction projects. Find out more at macquarie.com.


Contacts

PR Contacts
Rob Dalton, Xpansiv
This email address is being protected from spambots. You need JavaScript enabled to view it.

Charlie Morrow and Taylor Fenske
Cognito Media
This email address is being protected from spambots. You need JavaScript enabled to view it.

Halliburton Chairman, President and CEO Jeff Miller Participates in Nov. 1 Strategic Panel

ABU DHABI--(BUSINESS WIRE)--Halliburton Company (NYSE: HAL) today announced new products that highlight innovative technologies and sustainable solutions as part of its presence at the Abu Dhabi International Petroleum Exhibition and Conference (ADIPEC). In addition, Halliburton Chairman, President, and CEO Jeff Miller will participate Tuesday, Nov. 1 at 1:45 p.m. on the strategic panel, “Reconciling upstream oil and gas investment and the energy transition to meet global energy demand growth.” Miller will discuss how the industry addresses its commitment to decarbonization and the energy transition while ensuring the worldwide economy has the fuel it needs to continue to grow.


Collectively, the new technologies promote more precise and efficient drilling performance, remote automation for enhanced safety, and a reduced carbon footprint for cementing activities.

The BrightStar® look-ahead resistivity service, the most recent addition to the Halliburton iStar™ drilling and logging platform, reveals the path ahead of the bit to deliver superior drilling performance and consistent well delivery. In one compact collar design, the BrightStar service maps formation and fluid boundaries up to 100 feet (30 meters) ahead of the bit, detecting formation changes with near-bit resistivity and anisotropy to increase geo-stopping confidence and accelerate proactive drilling decisions.

The FloConnect® surface automation platform is a fully automated and scalable solution for efficient and safe surface well testing operations. An industry first, FloConnect controls, measures, and analyzes surface well testing through automated workflows. It allows data access in real time, process monitoring, and control from a command center or remote location. FloConnect reduces operational variabilities and optimizes workforce deployment, which improves personnel safety and lowers exposure to hazardous and complex operations by taking personnel out of the red zone.

The NeoCem™ E+ and EnviraCem™ systems leverage synergies between the chemical and physical properties of specialized materials combined with Portland cement. Halliburton’s innovative tailoring process engineered these reduced Portland systems to deliver high-performance, compressive strength and ductility at a lower density than conventional systems for improved barrier dependability. The Portland cement reduction helps customers lower their carbon emissions and provides engineered cement systems with enhanced cement sheath performance.

Join Halliburton Oct. 31 – Nov. 1 in Hall 5, booth #5250 to learn more about the Company’s innovative technologies and sustainable solutions.

ABOUT HALLIBURTON

Halliburton is one of the world’s leading providers of products and services to the energy industry. Founded in 1919, we create innovative technologies, products, and services that help our customers maximize their value throughout the life cycle of an asset and advance a sustainable energy future. Visit us at www.halliburton.com; connect with us on Facebook, Twitter, LinkedIn, Instagram and YouTube.


Contacts

Investor Relations Contact
David Coleman
This email address is being protected from spambots. You need JavaScript enabled to view it.
281-871-2688

Press Contact
Brad Leone
This email address is being protected from spambots. You need JavaScript enabled to view it.
281-871-2601

First units of new game-changing connected single-gas detector delivered in North America


CALGARY, Canada--(BUSINESS WIRE)--$BLN #TSX--Blackline Safety Corp. (TSX: BLN), a global leader in connected safety technology, today announced that its latest industry game-changer – the G6 single-gas wearable – is now shipping its first orders starting in North America, with European order fulfillment to follow in the coming weeks.

“G6 is now shipping in North America, allowing us to begin protecting workers by transforming single-gas detection through connectivity to protect and save lives,” said Cody Slater, Chair and CEO, Blackline Safety.

“We are also pleased to announce that through a proactive strategy to manage supply chain risk, we have secured the necessary components to deliver G6 volumes according to schedule. Demand and interest in the G6 have remained positive, giving us confidence in an acceleration in shipments as we move into calendar 2023.”

Unveiled in September 19th, 2022 at the National Safety Council (NSC) Congress and Expo, G6 is a fully connected and intuitive solution that leverages the latest in Internet of Things (IoT), providing worker location data through its integrated location technology and instant cloud connectivity during incidents. Over time, data from G6 usage helps organizations get ahead of possible safety risks by leveraging visuals of high alarm rates and low compliance as well as data insights from its analytics platform.

G6 also delivers expanded benefits such as a full-year battery life, lower total cost of ownership and fewer false alarms. More importantly, it gives safety professionals access to the trusted data they need to manage their safety protocols, processes, and ongoing compliance more effectively and efficiently.

“We’re excited to get our hands on G6 and introduce it to our clients who are looking for single-gas devices with longer battery life and access to data that helps protect lives,” said CJ Gregg, CEO, Becker Safety and Supply, a Blackline distributor, who received one of the first orders.

Blackline Safety is also at ADIPEC (Abu Dhabi International Petroleum Expo and Congress) this week giving companies across the Middle East a first look at G6. Certifications and first shipping for Europe and Rest of World are expected later this month.

About Blackline Safety: Blackline Safety is a technology leader driving innovation in the industrial workforce through IoT (Internet of Things). With connected safety devices and predictive analytics, Blackline enables companies to drive towards zero safety incidents and improved operational performance. Blackline provides wearable devices, personal and area gas monitoring, cloud-connected software and data analytics to meet demanding safety challenges and enhance overall productivity for organizations with coverage in more than 100 countries. Armed with cellular and satellite connectivity, Blackline provide a lifeline to tens of thousands of people, having reported over 185 billion data-points and initiated over five million emergency alerts. For more information, visit BlacklineSafety.com and connect with us on Facebook, Twitter, LinkedIn and Instagram.


Contacts

MEDIA
Blackline Safety
Christine Gillies, CMO
This email address is being protected from spambots. You need JavaScript enabled to view it.
+1 403-629-9434

“EVs for Education” will award funding to five schools in 2022, now accepting applications for 2023 grants

CHICAGO--(BUSINESS WIRE)--Students at five area public high schools will get behind the wheel of an electric vehicles (EV) in driver education class thanks to a $250,000 investment ComEd announced today with Chicago Public Schools (CPS) and educators from across the region. The ComEd EVs for Education program, which provides schools funding to offset the cost of an EV and EV charger, will give students first-hand experience driving EVs and learning about new zero-emissions vehicles on the rise in Illinois and across the country.

ComEd is now accepting applications for the 2023 program year. Schools interested in participating are encouraged to apply now until the deadline of Dec. 31, 2022. The application can be found on ComEd’s website.

“Thanks in part to Illinois’ Climate and Equitable Jobs Act (CEJA), EVs are gaining popularity in Illinois, and ComEd is taking steps to prepare the next generation for the new era of technology that’s proven to lower harmful tailpipe emissions and improve air quality for all our communities,” said Gil Quiniones, CEO of ComEd. “ComEd is proud to partner with school communities across the region to power education programs that will help remove barriers to EV use and inspire drivers to embrace this exciting new technology that is key to our clean energy future.”

ComEd made the announcement from Taft High School, located on Chicago’s northwest side, which received an EVs for Education grant in 2020, using it to purchase two new Chevy Bolts and two new charging stations for use in driver education. Since its launch in 2019, ComEd has directed $700,000 to 14 schools across northern Illinois, including six CPS schools.

Five new schools have been identified to participate in the 2022 program, including:

  • Dwight Township High School, Dwight, Ill.
  • Glenbard North High School, Carol Stream, Ill.
  • Harvard High School, Harvard, Ill.
  • Jefferson High School, Rockford, Ill.
  • Lane Tech College Prep High School, Chicago

Today’s students have more interest in electric vehicles than any previous generation, which is why it’s crucial that we introduce them to this experience as they learn the rules of the road,” said Pedro Martinez, CEO of Chicago Public Schools. “Working with ComEd, we are expanding this unique curriculum to new Chicago high schools every year and inspiring a new generation to take on new technologies that are key to our future.”

Schools invited to participate in EVs for Education receive a $50,000 grant to help electrify their driver education curriculum by adding an EV to their existing vehicle fleet and purchasing at least one Level 2 charger. In addition to providing students with experience behind the wheel of an EV, the program teaches them to identify the vehicle’s basic components, understand charging requirements and different types of charging equipment, and how to operate and charge an EV responsibly.

In addition to removing cost barriers that some school communities face in incorporating EVs, the program provides students and educators first-hand experiences with new forms of technology. ComEd teamed up with the Illinois High School & College Driver Education Association to create curriculum for the EVs for Education program.

“The ComEd EVs for Education Grant program is delivering new vehicles and equipment that will help thousands of public high school driver education students take steps to learn the rules of the road using electric vehicles,” said Wayne Hartmann, Board Representative for the Illinois High School & College Driver Education Association. “In addition to putting students in touch with cutting edge equipment, new curriculum we’ve helped developed for this program will help familiarize students with differences of driving and maintaining EVs, including charging methods. With EVs gaining more and more popularity in Illinois, the work ComEd is doing is essential to a safe adoption of this new technology by our newest drivers.”

To be eligible for an EVs for Education grant, applicants must be a public school driver education program, and be located in the ComEd service region. Applicants are prioritized if they are located within diverse communities or communities underserved by EV access/charging. More on program requirements can be found in the application.

“We are extremely excited to partner with ComEd and provide an amazing opportunity to the students of Harvard High School and future generations of CUSD 50 students and families,” said Katey Dietz, driver education team lead at Harvard High School. “In line with CUSD 50’s strategic plan, this partnership offers a variety of different vehicles for our students to learn with. With the support of this grant, Harvard High School along with the Harvard Community Education Foundation will be able to take steps so that our students can be exposed to green technology they may not yet have had the opportunity to see, let alone use. The EVs for Education program opens learning opportunities for our driver’s education students that would not be possible otherwise.”

EVs for Education is just one example of how ComEd is working to prepare communities for the rise in EV adoption expected in Illinois. Recent legislation passed by the state of Illinois and the federal government confront climate change in part by incentivizing the adoption of EVs, especially as transportation is the single biggest contributor of carbon pollution in the U.S. today. Through CEJA, Illinois has set forward clear markers on how to reduce carbon emissions, including a plan to add 1 million EVs to the roads by 2030.

“Dwight Township High School is pleased to partner with ComEd and to be a recipient of the EV grant,” said Dwight Public Schools Superintendent, Josh DeLong. “DTHS will use these funds to purchase an electric vehicle which will help us by having a much needed second driver's education vehicle, while at the same time teaching our students the benefits of electric cars. Thank you ComEd!”

ComEd is preparing its communities to unlock the benefits of EVs, which are proven to reduce carbon emissions, to enhance air quality, all while saving consumers on money otherwise spent at the pump. To support customers in navigating the journey to EVs, ComEd has introduced the EV Toolkit – an all-in-one resource providing information and tips on available resources and rebates, rate plans and cost savings options, where to find charging stations, and more.

Additionally, ComEd earlier this month announced a new DOE-funded grant that will enhance ongoing work to test the integration of extreme fast charging stations, a key component in not only growing the network of charging stations across the region, but helping to promote widespread adoption of EVs.

For more information on the benefits of EVs or to receive support from ComEd on an electrification project, customers are encouraged to visit our website or to reach out at This email address is being protected from spambots. You need JavaScript enabled to view it.

ComEd is a unit of Chicago-based Exelon Corporation (NASDAQ: EXC), a Fortune 200 energy company with approximately 10 million electricity and natural gas customers – the largest number of customers in the U.S. ComEd powers the lives of more than 4 million customers across northern Illinois, or 70 percent of the state’s population. For more information visit ComEd.com, and connect with the company on Facebook, Twitter, Instagram and YouTube.


Contacts

ComEd
Media Relations
312-394-3500

With lithium demand and cost surging, Cemvita launches program with AZL for environmentally friendly lithium extraction

DENVER--(BUSINESS WIRE)--#Biomining--Cemvita Factory (“Cemvita”) and Arizona Lithium Limited (“AZL”), an Australian Stock Exchange and OTC listed (ASX = AZL , OTC = AZLAF.NQO) lithium mining company focused on the sustainable development of the Big Sandy Lithium Project, announce the signing of a broad letter of intent (“LOI”) encompassing Cemvita installing a bio-lixiviant production facility at AZL’s Lithium Research Center in Tempe, AZ. With this facility, Cemvita will perform pilot testing on both tank and heap bioleaching for lithium extraction from clay or sedimentary materials.


The World Economic Forum identified lithium as one of the most important metals in the energy transition. However, it also noted that the increase in mining operations required to meet demand posed challenges to supply constraints as well as environmental impact. Novel technologies that use new, abundant sources of lithium and have a smaller carbon footprint are necessary for meeting the increasing demand in raw materials without the risk of a supply bottleneck.

Using Industrial Biotechnology, Cemvita intends to revolutionize the mining industry and lower the environmental footprint of mining. Cemvita’s Biomining team works with companies to optimize existing bioprocesses and develop new methods in mineral processing and extractive metallurgy to lower the energy and carbon intensity of the mining industry and enable extraction of the minerals needed for a renewable energy future. Processes that can be enhanced by the latest industrial biotech apply across the entire mining supply chain including mining and mineral pre-processing, in-situ recovery, leaching, beneficiation, remediation, and recycling.

The International Energy Agency identified sedimentary as a new, less carbon intensive source for supplying the world's lithium needs. Because of sedimentary's relative abundance in the United States, it will aid in securing the local lithium supply. Carbon intensity of lithium from sedimentary resources is expected to be substantially lower than hard rock operations, and with a lower water use footprint compared with brine resources. Cemvita’s natural organic extraction technology takes sustainability further, opening the opportunity for even lower cost operations such as heap and in-situ leaching. Heap and in-situ leaching provide a substantially lower physical, chemical and energy footprint.

This pilot work in Arizona,” said Cemvita’s Vice President Mining Biotech, Marny Reakes, “is a great step forward in our drive to both reduce the footprint of mining and unlock the mineral resources that are crucial for our planet’s renewable energy future.”

The global lithium market is rapidly growing, and consumers are increasingly buying electric vehicles, which rely on lithium-ion batteries. According to Global Electric Vehicle Outlook, “sales of electric cars doubled in 2021...[and] sales kept rising strongly into 2022.” The latest report on the global lithium market from Grey Views concludes that it “is expected to grow from USD 3.3 Billion in 2020 to USD 5.1 Billion by 2028, at a CAGR of 5.6%.”

AZL and Cemvita also plan to work towards deploying this technology for in-situ mining, a process where the ore is not removed from the ground but is extracted in place. This process aims to eliminate much of the ground disturbance and waste generation associated with typical mining operations.

“Our goal,” said Charles Nelson, Chief Business Officer of Cemvita, “is to enable the most environmentally friendly end to end process of mining lithium through the application of our technology. This includes utilizing cleaner methods of extraction with the option of layering Cemvita’s other beneficial technologies such as CO2 based fuels and decarbonizing processing in the mining space.”

Arizona Lithium’s Research Center, located in Tempe, AZ, is a facility designed as a commercial pilot to allow both AZL and third-party producers to take large volumes of ore from their prospective mines and test all components of the processing of the ore through the production of various grades of battery grade lithium materials. The facility is planned to be in operation in early 2023.

AZL Managing Director, Paul Lloyd, said:We are very pleased to have signed this partnership with Cemvita. We are focused on our responsibility to our shareholders and to the environment, and believe that both of these stakeholders will greatly benefit from the successful implementation of Cemvita’s technology. We aim to be a model for sustainable development, and be the pioneer for Lithium producers to use technology like Cemvita’s. We are excited to see the results of the partnership start to show in the next 3-6 months at which time we will assess further partnership potential.”

About Cemvita Factory

Cemvita Factory is on a mission to reimagine the heavy industries such as oil & gas and mining for the net-zero economy. This is done through the sustainable extraction of natural resources, carbon negative production of chemicals, and closed-loop renewal of waste as feedstock.

Visit www.cemvitafactory.com for more information.


Contacts

This email address is being protected from spambots. You need JavaScript enabled to view it.
832-526-7531

DUBLIN--(BUSINESS WIRE)--As part of its ongoing commitment to becoming a model of inclusion and diversity (I&D) in its industry, intelligent power management company Eaton (NYSE:ETN), released its second annual Global Inclusion and Diversity Transparency report. The report details the progress the company has made in achieving its ambitious 2030 inclusion and diversity (I&D) commitments. They include:


  • Maintaining or exceeding the current representation of women and U.S. minorities on the board of directors and global leadership team.
  • Increasing representation of salaried global women to 40%.
  • Increasing representation of salaried U.S. minorities to 34%.
  • Achieving an inclusion index score of 80% or higher in our employee engagement survey.

“We’ve established ambitious 2030 commitments because we know diverse teams drive smarter, more innovative decisions,” said Ernest Marshall Jr., executive vice president and chief human resources officer, Eaton. “They spark creativity and challenge our way of thinking, which strengthens our performance.”

Highlights from the report include:

  • More than two-thirds of Eaton’s directors are either women or U.S. minorities and 54% of the company’s global leadership team is made up of U.S. minorities.
  • Second Chance hiring practices continue to broaden Eaton’s talent pool and improve access to employment and advancement for people with prior criminal convictions.
  • Global services and allyship programs enhance support for well-being and mental health.
  • Spending with diverse suppliers, including minority- and disabled-owned businesses, increased year-over-year.

“We are committed to addressing systemic inequity and ensuring an inclusive workplace for all employees,” said Monica Jackson, vice president, Global Inclusion and Diversity, Eaton. “This is not a new journey for us. We will continue to be transparent and hold ourselves accountable, recognizing there is more work to do.”

To view open global positions at Eaton, click here.

Eaton is an intelligent power management company dedicated to improving the quality of life and protecting the environment for people everywhere. We are guided by our commitment to do business right, to operate sustainably and to help our customers manage power ─ today and well into the future. By capitalizing on the global growth trends of electrification and digitalization, we’re accelerating the planet’s transition to renewable energy, helping to solve the world’s most urgent power management challenges, and doing what’s best for our stakeholders and all of society.

Founded in 1911, Eaton has been listed on the NYSE for nearly a century. We reported revenues of $19.6 billion in 2021 and serve customers in more than 170 countries. For more information, visit www.eaton.com. Follow us on Twitter and LinkedIn.


Contacts

Drew Horansky
+1 (440) 523-4306
This email address is being protected from spambots. You need JavaScript enabled to view it.

Integrated Marketing Agency Tasked With Launching Brand Awareness Campaign for Leading Marine Electronics Company

FRAMINGHAM, Mass.--(BUSINESS WIRE)--CommCreative, a leading digital-first marketing agency, today announced that it has been named the agency of record for Raymarine's North America region. Raymarine is a world leader in creating marine electronics that offer unmatched reliability, giving boaters the freedom to embark on every adventure with confidence. CommCreative is developing and executing brand messaging and a go-to-market strategy, including creative, digital, social media and mobile advertising.


“Raymarine stands for reliability, confidence and doing the right thing – and we looked for the same in our agency partner,” said Stacey Ogden, Director of Maritime and Raymarine Marketing. “We look forward to partnering with CommCreative to continue to grow our brand, tell our stories to American boaters and fishermen, and deepen our connection in the community.”

The main goal of this partnership is to build a B2C narrative and tell the Raymarine brand story in a human-centric, emotionally compelling way. Using the latest technology to target consumers based on their intent, geo-location and smart social media advertising, an integrated strategy and creative campaign was recently launched to activate and optimize awareness with a focus on boat owners and the fishing community in the Americas.

“We are humbled and excited to be chosen by the team at Raymarine to capitalize on this amazing opportunity for the brand as the boating and fishing industry continues to grow and expand,” said Joanna Bittle, Agency Partner at CommCreative. “For the past 80 years, they have been committed to serving as a trusted guide for boaters of all kinds and have helped lead the charge of improving sustainability within the maritime industry. We are proud to partner with Raymarine and look forward to a partnership for years to come.”

To view some of CommCreative’s latest creative work, please visit www.commcreative.com/creative.


Contacts

Media:
CommCreative
Jayne Keenan, 508-861-2838
Account Director
This email address is being protected from spambots. You need JavaScript enabled to view it.

NEW YORK--(BUSINESS WIRE)--One Equity Partners Open Water I Corp. (NASDAQ: OEPW, OEPW.U, OEPW) (“OEPW” or the “Company”), announced today that it has filed a preliminary proxy statement to seek stockholder approval to adopt amendments to its Amended and Restated Certificate of Incorporation (“Charter”) to allow the Company to redeem all of its outstanding public shares and liquidate no later than December 30, 2022, in advance of the automatic termination date in its current Charter of January 26, 2023.

Since OEPW’s consummation of its initial public offering on January 26, 2021, the OEPW management has conducted a rigorous search for appropriate targets, with the goal of completing a business combination that met its investment criteria. OEPW management has thoroughly evaluated current adverse market conditions including unconducive capital markets, an overall decline in the SPAC market and a limited pool of public company-ready business combinations interested in pursuing a business combination via a SPAC, which have complicated efforts to find an appropriate target. OEPW management has also reviewed recent changes in U.S. tax law that could create tax liabilities in connection with stockholder redemptions after December 31, 2022. As a result of these factors, OEPW believes that it is in the best interests of its stockholders to liquidate the Company early.

OEPW will seek a vote in favor of amendments to the Company’s Certificate of Incorporation from stockholders at a special meeting to be held later this year. As part of that process, the holders of public shares will have an opportunity to submit their shares for redemption, subject to the provisions of OEPW’s Charter. For more information, please see the preliminary proxy statement filed with the Securities and Exchange Commission (the “SEC”) on October 28, 2022.

Forward-Looking Statements

This press release includes “forward-looking statements” within the meaning of Section 27A of the Securities Act of 1933, as amended, and Section 21E of the Securities Exchange Act of 1934, as amended. All statements other than statements of historical fact included in this press release are forward-looking statements, including statements relating to the proposed early unwind of the Company. Such forward-looking statements are based on the beliefs of management, as well as assumptions made by, and information currently available to, the Company’s management. Actual results could differ materially from those contemplated by the forward-looking statements as a result of certain factors detailed in the Company’s filings with the SEC. All subsequent written or oral forward-looking statements attributable to us or persons acting on our behalf are qualified in their entirety by this paragraph. Forward-looking statements are subject to numerous conditions, many of which are beyond the control of the Company, including those set forth in the Risk Factors section of the Company’s latest Annual Report on Form 10-K and subsequent Quarterly Reports on Form 10-Q filed with the SEC. The Company undertakes no obligation to update these statements for revisions or changes after the date of this release, except as required by law.

About OEPW

One Equity Partners Open Water I Corp. is a blank check company formed for the purpose of effecting a merger, capital stock exchange, asset acquisition, stock purchase, reorganization or similar business combination involving one or more businesses.

Additional Information

On October 28, 2022, OEPW filed a preliminary proxy statement with the SEC in connection with its solicitation of proxies for its special meeting of stockholders. Prior to the special meeting, OEPW will file with the SEC and furnish to stockholders a definitive proxy statement, together with a proxy card. INVESTORS AND SECURITY HOLDERS OF OEPW ARE URGED TO READ THE DEFINITIVE PROXY STATEMENT (INCLUDING ANY AMENDMENTS OR SUPPLEMENTS THERETO) AND OTHER DOCUMENTS OEPW FILES WITH THE SEC CAREFULLY IN THEIR ENTIRETY WHEN THEY BECOME AVAILABLE AS THEY WILL CONTAIN IMPORTANT INFORMATION. Investors and security holders will be able to obtain free copies of the definitive proxy statement (including any amendments or supplements thereto) and other documents filed with the SEC through the web site maintained by the SEC at www.sec.gov. Copies will also be available free of charge to the public on, or accessible through, the Company’s corporate website under the heading “SEC Filings” at https://oepopenwater.com/.

Participants in the Solicitation

OEPW, its directors and certain of its executive officers and employees may be deemed to be participants in the solicitation of proxies from stockholders in connection with the special meeting. Additional information regarding the identity of these potential participants and their direct or indirect interests, by security holdings or otherwise, is set forth in the preliminary proxy statement for the special meeting that was filed on October 28, 2022, and will be set forth in the definitive proxy statement and other materials to be filed with the SEC in connection with the special meeting. You may obtain free copies of these documents using the sources indicated above.


Contacts

For One Equity Partners
Charlyn Lusk
Stanton
646-502-3549
This email address is being protected from spambots. You need JavaScript enabled to view it.

Zero EV and Jaunt Motors merge to create a global EV powerhouse

BRISTOL, United Kingdom--(BUSINESS WIRE)--Two of the world’s premier technology companies converting traditional petrol and diesel cars into electric vehicles – Zero EV based out of Bristol in the UK and Jaunt Motors from Melbourne, Australia — have merged to create Fellten. The new company is now the world’s leading electric conversion systems manufacturer with a presence across three continents.


Set to be officially unveiled at Specialty Equipment Market Association (SEMA) show in Las Vegas, NV, tomorrow, the new company is scaling up to meet exponential global demand, establish a facility in North America and continue to lead the industry in quality, safety, reliability and volume, as well as electric conversion training programs for the automotive industry.

Fellten (Welsh for lightning) designs, engineers and manufactures bolt-in systems to convert classic cars into electric vehicles (EVs). The merger gives the new company an international supply chain that allows automotive workshops and vehicle restorers across Australia, North America and Europe to install electric conversion systems designed and developed by Fellten’s world class team.

Fellten’s electric systems with original equipment manufacturer (OEM) levels of performance and reliability enable cars of any era to be a ‘daily driver’ and not just an enthusiast’s car. Fellten powered vehicles are re-fitted to improve safety, handling, comfort, usability and performance and sustainability, all without sacrificing the classic style of the car.

Fellten has engineered systems for a variety of classic brands and models, starting with Porsche 911s, Classic Minis, and Land Rover Series and Defenders, with more electrification solutions for more classic brands and models coming.

Alongside the electric conversion technology, Fellten has developed City & Guilds approved training programs. Leaders in up-skilling staff in working with electric vehicles, systems installation and maintenance for bulk purchases, their team has trained a number of high-profile clients to date including leading Universities, major Hollywood studios and other film industry specialists and OEM garage technicians and mechanics across Europe and North America.

Globally, there are a growing number of electric vehicle conversion workshops, however Fellten is the only company in the industry with ISO compliance in quality, environmental and health and safety management (ISO 9001, 14001, 45001). Combined with systemised processes that allow true manufacturing scale, Fellten is able to deliver electric conversion solutions compliant across the UK, North America, Asia Pacific and most of Europe.

The merging of the two autotech leaders will allow for Fellten to establish a global presence, as well as build new partnerships with international motoring partners.

Zero EV Co-founder and CEO, and now CEO of Fellten, Chris Hazell, said: “We are delighted to launch Fellten – it’s the culmination of years of work from two teams working on other sides of the world, coming together with the shared ambition in shaping the future of electric vehicles.”

“The merging of our two companies into the singular Fellten will provide classic vehicle customers with any level of electrification support, and provide automotive experts, mechanics and electric vehicle converters with the technology, tools and training to be a part of the growing global demand for electrification.”

Jaunt Motors Co-founder and CEO, and now Chief Design Officer of Fellten, Dave Budge, said: “Every vehicle on the road will need to be electric by 2050 for us to achieve net zero emissions and classic car owners will want their vehicle to be electric much sooner. With production facilities on three continents, industry-leading technology and development capabilities, Fellten is ready to meet those needs for consumers and the automotive industry.

"With the support of the global Fellten engineering team, proprietary EV technology and strategic partnerships with leading manufacturers, Fellten provides specialist and luxury vehicle customers with complete electrification support, from design to technology development to delivery.”

Officially launching at SEMA, Fellten is planning for the launch of their US facility early next year, while expanding their systems production and training in the UK and Australia, details of which will be announced in the coming months.

Merger Overview

Fellten’s global team of automotive and electrical engineers, software developers, designers, and trainers is comprised of Jaunt Motors and Zero EV team members all working under the Fellten banner. Under the restructure, the global leadership team is comprised of:

  • Chris Hazell - CEO, Chief Executive Officer.
  • Alex Dawood - CTO, Chief Technology Officer.
  • Marteen Burger - COO, Chief Operating Officer.
  • Dave Budge - CDO, Chief Design Officer.
  • Mark Poole - CFO, Chief Financial Officer.

>> Click Here for High-Resolution Assets <<

About Fellten

Fellten is a global electric conversion systems manufacturer creating solutions for car owners and car workshops to convert traditional petrol and diesel cars into electric vehicles. Fellten has engineered systems for a variety of classic brands and models, starting with Porsche 911s, Classic Minis, and Land Rover Series and Defenders.


Contacts

For any more information and interviews:
Jonas Tobias, Senior Account Manager at Compass Studio on 0431 906 814 or This email address is being protected from spambots. You need JavaScript enabled to view it.

NEW YORK & OSLO, Norway & LUXEMBOURG--(BUSINESS WIRE)--FREYR Battery (NYSE: FREY) (“FREYR”), a developer of clean, next-generation battery cell production capacity, will publish a press release detailing third quarter 2022 results and conduct a conference call on November 14, 2022.


The third quarter 2022 press release will be issued by 6:00 am U.S. Eastern Standard Time (12:00 pm Central European Time). The conference call is scheduled to begin at 7:30 am U.S. Eastern Standard Time (1:30 pm Central European Time).

To access the conference call, listeners should contact the conference call operator at the appropriate number listed below approximately 10 minutes prior to the start of the call.

Participant conference call dial-in numbers:

United Kingdom: 020 3936 2999
United States: 1 (646) 664 1960
All other locations: +44 20 3936 2999

The participant passcode for the call is: 303285

A webcast of the conference call will be broadcast simultaneously at https://streams.eventcdn.net/freyer/2022q3 on a listen-only basis. Please log in at least 10 minutes in advance to register and download any necessary software.

A replay of the webcast will be available at https://ir.freyrbattery.com/events-and-presentations/Events-Calendar/default.aspx.

About FREYR Battery

FREYR Battery aims to provide industrial scale clean battery solutions to reduce global emissions. Listed on the New York Stock Exchange, FREYR’s mission is to produce green battery cells to accelerate the decarbonization of energy and transportation systems globally. FREYR has commenced building the first of its planned factories in Mo i Rana, Norway and announced potential development of industrial scale battery cell production in Vaasa, Finland, and the United States. FREYR intends to install 50 GWh of battery cell capacity by 2025 and 100 GWh annual capacity by 2028 and 200 GWh of annual capacity by 2030. To learn more about FREYR, please visit www.freyrbattery.com.


Contacts

Investor contact:

Jeffrey Spittel
Vice President, Investor Relations
This email address is being protected from spambots. You need JavaScript enabled to view it.
Tel: (+1) 281-222-0161

Media contact:

Katrin Berntsen
Vice President, Communication and Public Affairs
This email address is being protected from spambots. You need JavaScript enabled to view it.
Tel: (+47) 9920 54 570

  • Xendee’s integrated platform provides a standardized approach that cuts microgrid design time, slashes engineering expenses, and is scalable across the Department of Defense.
  • Xendee deployed its microgrid software at three sites: The Naval Submarine Base Kings Bay, The USAG Bavaria, and The Naval Base San Diego.
  • The average costs to complete even the most complex modeling using Xendee’s solutions resulted in less than 1 percent of total project costs.

SAN DIEGO--(BUSINESS WIRE)--#asu--Due to the growing threat of blackouts, the U.S. Department of Defense (DoD), through its Environmental Security Technology Certification Program (ESTCP), has enlisted Xendee, a provider of microgrid decision support software, to help significantly cut energy system engineering costs. With the DoD identifying microgrids as a critical technology for increased security, energy efficiency, and resilience at new and existing military installations, the value of microgrids is clear. However, this technology must be optimally planned, designed, deployed, and managed in order to meet organizational goals and mission-critical loads.


As part of this program, Xendee's software is demonstrated at three different DoD installations. The Naval Submarine Base Kings Bay mandated resilience against outages as a major design priority. Another focus of this installation was examining the ongoing installation upgrades to determine feasibility, return, and alternatives. The USAG Bavaria project, in Grafenwöhr/Vilseck, Germany, included optimized investment, placement, dispatch, financial analysis, power flow engineering, and training for Army staff. This facility also included a full electrical heating system. The Naval Base San Diego was the final demonstration and examined how an onsite microgrid installation could be more cost and emission-efficient than running new cabling to the building.

"Microgrids can reduce military installations' energy and physical footprint and increase resiliency. They lessen dependence on fuel supplies and their impacts on local communities while improving uninterrupted power. This is all without disruptions to local utility networks," said Michael Stadler, CTO and co-founder of Xendee. "Through Xendee's ability to streamline the microgrid design process while cutting costs and increasing efficiency, these three-site demonstrations confirm the value that Xendee's tool can offer to a military audience."

Xendee’s platform assessed a number of technologies at these installations, including solar, battery storage, diesel generators, heat pumps, Combined Heat and Power (CHP) engines, and cable and transformer upgrades. Xendee’s optimization engine then analyzed and optimized the investment strategy taken, the sizing and placement of technologies, and the actual dispatch of the system over every time step of the year. This technology streamlined the whole microgrid design and implementation process, saving engineering time and removing the burden and risk of transferring data between systems.

Additionally, as part of this project, Xendee and its partner, Arizona State University, created a DoD-specialized training curriculum designed to train service members on how to use the Xendee software. Xendee also completed DoD Cybersecurity Maturity Model Certification (CMMC), making it a cyber secure platform for DoD applications.

“Our primary objective was to train uniformed and civilian military personnel on a standardized, repeatable process for building and interpreting microgrid models,” said Nathan Johnson, Associate Professor in The Polytechnic School at Arizona State University and Director of the Laboratory for Energy And Power Solutions (LEAPS). “Additionally, by mapping the training program and certificates to military job codes, ASU and Xendee have created a pipeline for training and deploying DoD certified users at scale.” This effort extends a history of training provided by Arizona State University to installation personnel and transitioning Veterans.

Xendee recently announced an integration with UtilityAPI to offer engineers more accurate load data and emission profiles. The integration is meant to aid users in efficiently downloading past building load data directly from utilities, giving engineers more accuracy in past usage and peak project requirements. Xendee also unveiled its new multi-node feature for designing sustainable communities, large facilities, and utility-scale microgrids. Users can connect up to 25 different technologies to generate advanced microgrid designs applicable to real-world positioning.

About Xendee Corporation

Xendee is the new standard in distributed energy system design and operation. The award winning platform integrates the microgrid design process into one piece of software and allows users to rapidly validate projects of any size, optimize designs, optimize investments, and operate microgrids in realtime to reach their full potential. Xendee’s software can model up to 25 different DER technologies and calculates the optimal techno-economic solution for each site individually to meet organizational goals. These goals can include reducing costs, cutting CO2 emissions, increasing resilience, or a combination of all three. Learn more about the clean energy platform or take your first steps towards net-zero carbon and reducing your scope 1 & 2 emissions by setting up a call with us at xendee.com/demo.


Contacts

Media Contact
Jay Gadbois
This email address is being protected from spambots. You need JavaScript enabled to view it.

DUBLIN--(BUSINESS WIRE)--The "Inland Water Passenger Transport Global Market Report 2022: By Mode, By Application" report has been added to ResearchAndMarkets.com's offering.


This report provides strategists, marketers and senior management with the critical information they need to assess the global inland water passenger transport market as it emerges from the COVID-19 shut down.

The global inland water passenger transport market is expected to grow from $1.49 billion in 2021 to $1.6 billion in 2022 at a compound annual growth rate (CAGR) of 7.0%. The market is expected to grow to $1.99 billion in 2026 at a compound annual growth rate (CAGR) of 5.7%.

Companies Mentioned

  • American Commercial Lines LLC.
  • Ingram Industries
  • Jeffboat
  • European Cruise Service
  • Alnmaritec Ltd.
  • Bayliner
  • Groupe Beneteau
  • CIWTC
  • CMA CGM Group
  • Carnival Corporation
  • RCCL Royal Caribbean
  • MSC (Mediterranean Shipping Company)
  • AIDA Cruises
  • Norwegian Cruise Line

Reasons to Purchase

  • Gain a truly global perspective with the most comprehensive report available on this market covering 12+ geographies
  • Understand how the market is being affected by the coronavirus and how it is likely to emerge and grow as the impact of the virus abates
  • Create regional and country strategies on the basis of local data and analysis
  • Identify growth segments for investment
  • Outperform competitors using forecast data and the drivers and trends shaping the market
  • Understand customers based on the latest market research findings
  • Benchmark performance against key competitors
  • Utilize the relationships between key data sets for superior strategizing
  • Suitable for supporting your internal and external presentations with reliable high quality data and analysis

The inland water passenger transport market consists of sales of inland water passenger transportation and related services by entities (organizations, sole traders, and partnerships) that provide inland water transportation of passengers on lakes, rivers, or intra-coastal waterways.

The main passenger transportation type in the inland water passenger transport market are canal passenger transportation, intercostal transportation of passengers, lake passenger transportation, water shuttle services, river passenger transportation, ship chartering with the crew, and water taxi services. The lake passenger transportation provides inland water transportation of passengers on lakes. The market is segmented by mode into cruise ships, cargo-passenger ships, ferry ships, and others and by application into the supply chain, distribution, and end customers.

Western Europec was the largest region in the a inland water passenger transport market in 2021. Asia Pacific was the second largest region in the a inland water passenger transport market. The regions covered in this report are Asia-Pacific, Western Europe, Eastern Europe, North America, South America, Middle East, and Africa.

The rising use of boats through inland waterways as a means of providing sightseeing services is expected to drive the inland water passenger transport market. There are many places such as The Mine Bay Rock Carvings in New Zealand, Horizontal Falls in Australia, Agia Roumeli in Greece, and others that are not accessible by roads but only through waterways, generating higher demand for inland water passenger transport services.

According to Voices navigable de France, the French navigation authority, sightseeing vessels carried 11 million passengers and employed 1,440 people in France. Moreover, according to the European Barge Union Annual Report 2019-2020, the number of cruise passengers on European rivers increased by 9.9%, reaching 1.79 million passengers. Hence, an increase in the use of boats through inland waterways for sightseeing is boosting the inland water passenger transport market.

Safety issues associated with boat services operating on inland waterways like rivers, lakes, and others are expected to limit the growth of the inland water passenger transport market. Traveling by boat in inland waterways is always associated with risks. Overloading, or even minor negligence, can lead to an unfortunate incident that could lead to a loss of life.

According to 2019 Recreational Boating Statistics published by US Coast Guard, in 2019, 4,168 accidents including 2,559 injuries, 613 deaths, and about $55 million property damage was reported due to recreational boating accidents. In addition to this, according to the Australian Maritime Safety Authority, in August 2020, Australia reported 83 incidents, involving domestic commercial vessels.

Factors such as overcrowding, not maintaining proper safety measures, natural disasters, the sudden climate change are reasons for poor safety for passengers, restricting the growth of the inland water passenger transport market.

Companies in the inland water passenger transport market are increasingly implementing technology for enhancing the passenger and guest experience on-board. Cruise and ferry boats are among the first inland water passenger ships to adopt and integrate the technology

The countries covered in the inland water passenger transport market are Australia, Brazil, China, France, Germany, India, Indonesia, Japan, Russia, South Korea, UK, and USA.

For more information about this report visit https://www.researchandmarkets.com/r/jgf347


Contacts

ResearchAndMarkets.com
Laura Wood, Senior Press Manager
This email address is being protected from spambots. You need JavaScript enabled to view it.
For E.S.T Office Hours Call 1-917-300-0470
For U.S./ CAN Toll Free Call 1-800-526-8630
For GMT Office Hours Call +353-1-416-8900

DUBLIN--(BUSINESS WIRE)--The "United States Spacer Fluid Market By Application (Onshore and Offshore), By Type (Water-Based Drilling Fluid Environment and Oil-Based Drilling Fluid Environment), and By Region, Competition, Forecast and Opportunities, 2017-2028" report has been added to ResearchAndMarkets.com's offering.


The United States spacer fluid market is expected to witness an impressive CAGR during the forecast period, 2023-2027

Rising investments in exploration, production, drilling, and drilling operations, as well as increasing energy requirements, are the primary drivers for the United States spacer fluid market. The abundance of tight oil and unconventional natural resources is anticipated to open up new growth prospects for the US spacer fluid industry.

Traditional energy sources are so widely used in transportation, manufacturing, power production, and other end-use industries that there is an excessive demand for them. The need to discover new oil and gas reserves is anticipated to be greatly influenced by the rise in demand for unconventional energy sources, including tight gas, shale oil, and coal bed methane.

Oil and gas wellbores are expanding, which is boosting the demand for sophisticated exploration and drilling techniques to meet the nation's expanding energy needs. The increase in drilled footage per well is being driven by a switch from vertical to horizontal drilling techniques. In order to increase productivity, the majority of freshly drilled wells are horizontally drilled and hydraulically fractured.

Oil, gas, and other hydrocarbons are still regarded as one of the most reliable and efficient energy sources, luring businesses to expand their infrastructure and develop cutting-edge methods to speed up the cementing of wells. The average amount of crude oil produced is rising and efforts to increase the productivity, such as the extraction of tight oil in West Texas and New Mexico, and cost-effectiveness of wells are expected to influence the market demand.

As a result, the market for spacer fluid in the United States is anticipated to grow more quickly during the projected period due to the growing emphasis on recovering from unexplored oil and gas sources.

The United States spacer fluid market is segmented into application, type, regional distribution, and competitive landscape. Based on application, the market is divided into onshore and offshore. The onshore segment is expected to capture the highest market share during the forecast period, 2023-2027.

The growth of onshore drilling activities is primarily driven by an increase in oil and gas drilling activities and the steadily rising demand from the Permian Basin. The Permian Basin is the world's top crude oil producer and the nation's greatest shale producer. It is anticipated that increasing demand for unconventional resources, particularly in the Delaware Basin and Marfa Basin, will support onshore activity in the United States.

Objective of the Study:

  • To analyze the historical growth in the market size of the United States spacer fluid market from 2017 to 2021.
  • To estimate and forecast the market size of the United States spacer fluid market from 2022 to 2027 and growth rate until 2027.
  • To classify and forecast the United States spacer fluid market based on application, type, region, and company.
  • To identify the dominant region or segment in the United States spacer fluid market.
  • To identify drivers and challenges for the United States spacer fluid market.
  • To examine competitive developments such as expansions, new product launches, mergers & acquisitions, etc., in the United States spacer fluid market.
  • To identify and analyze the profiles of leading players operating in the United States spacer fluid market.
  • To identify key sustainable strategies adopted by market players in the United States spacer fluid market.

Competitive Landscape

Company Profiles: Detailed analysis of the major companies present in United States spacer fluid market.

  • AubinGroup
  • Baker Hughes Company
  • BASF SE
  • Chevron Phillips Chemical Company
  • Croda International Plc.
  • Halliburton Company
  • Impact Fluid Solutions
  • M & D Industries of LA Inc.
  • Schlumberger Limited
  • Trican Well Service Ltd.

Report Scope:

Years considered for this report:

  • Historical Years: 2017-2020
  • Base Year: 2021
  • Estimated Year: 2022
  • Forecast Period: 2023-2027

United States Spacer Fluid Market, By Application:

  • Onshore
  • Offshore

United States Spacer Fluid Market, By Type:

  • Water-Based Drilling Fluid Environment
  • Oil-Based Drilling Fluid Environment

United States Spacer Fluid Market, By Region:

  • South
  • West
  • Mid-West
  • North-East

For more information about this report visit https://www.researchandmarkets.com/r/f2a6hg


Contacts

ResearchAndMarkets.com
Laura Wood, Senior Press Manager
This email address is being protected from spambots. You need JavaScript enabled to view it.

For E.S.T. Office Hours Call 1-917-300-0470
For U.S./ CAN Toll Free Call 1-800-526-8630
For GMT Office Hours Call +353-1-416-8900

  • Reported earnings of $11.2 billion; adjusted earnings of $10.8 billion
  • Cash flow from operations of $15.3 billion; free cash flow of $12.3 billion
  • Shareholder distributions of $6.5 billion

SAN RAMON, Calif.--(BUSINESS WIRE)--Chevron Corporation (NYSE: CVX) today reported earnings of $11.2 billion ($5.78 per share - diluted) for third quarter 2022, compared with $6.1 billion ($3.19 per share - diluted) in third quarter 2021. Included in the current quarter were pension settlement costs of $177 million. Foreign currency effects increased earnings by $624 million. Adjusted earnings of $10.8 billion ($5.56 per share - diluted) in third quarter 2022 compares to adjusted earnings of $5.7 billion ($2.96 per share - diluted) in third quarter 2021.


Sales and other operating revenues in third quarter 2022 were $64 billion, compared to $43 billion in the year-ago period.

Earnings Summary


Three Months
Ended September 30

Nine Months
Ended September 30

Millions of dollars

2022


2021


2022


2021


Earnings by business segment


Upstream

$

9,307


$

5,135


$

24,798


$

10,663


Downstream


2,530


1,310


6,383


2,154


All Other


(606

)


(334

)


(2,069

)


(2,247

)

Total (1)(2)

$

11,231


$

6,111


$

29,112


$

10,570


(1) Includes foreign currency effects

$

624


$

305


$

1,074


$

346


(2) Net income attributable to Chevron Corporation (See Attachment 1)

“We delivered another quarter of strong financial performance with return on capital employed of 25 percent,” said Mike Wirth, Chevron’s chairman and chief executive officer. “At the same time, we’re increasing investments and growing energy supplies, with our Permian production reaching another quarterly record.”

During the quarter, the company paid dividends of $2.7 billion (6 percent higher per share than third quarter 2021), increased investments by over 50 percent from last year, paid down debt for the sixth consecutive quarter, and repurchased $3.75 billion of shares (more than 1 percent of shares outstanding). The company’s third quarter Permian Basin unconventional production totaled over 700,000 barrels of oil equivalent per day, up over 12 percent from last year’s quarter.

“We’ve also taken important steps to position both our traditional and new energy businesses to help meet the world’s growing demand for our products,” Wirth concluded. The company’s recent business highlights include:

  • Approved a project to increase light crude oil processing capacity by 15 percent at the company’s Pasadena, Texas refinery.
  • Entered Namibia by acquiring an 80 percent working interest in a Deepwater oil and gas exploration lease.
  • Received permits, as part of joint ventures, to assess carbon storage for three blocks totaling nearly 7.8 million acres in offshore Australia.
  • Broke ground on a lower carbon feedstock expansion project at the company’s bio-refinery in Germany.
  • Delivered renewable natural gas for the first time from the Brightmark RNG Holdings LLC joint venture project in South Dakota.

UPSTREAM

Worldwide net oil-equivalent production was 3.03 million barrels per day in third quarter 2022. International production decreased 3 percent primarily due to the end of concessions in Thailand and Indonesia, while U.S. production increased 4 percent compared to the same period a year ago, mainly in the Gulf of Mexico and the Permian Basin.

U.S. Upstream


Three Months
Ended September 30

Nine Months
Ended September 30

Millions of dollars

2022

2021

2022

2021

Earnings

$

3,398

$

1,962

$

10,004

$

4,349

U.S. upstream operations earned $3.40 billion in third quarter 2022, compared with $1.96 billion a year earlier. The improvement was primarily due to higher realizations and higher volumes, partially offset by the absence of third quarter 2021 asset sale gains.

The company’s average sales price per barrel of crude oil and natural gas liquids was $76 in third quarter 2022, up from $58 a year earlier. The average sales price of natural gas was $7.05 per thousand cubic feet in third quarter 2022, up from $3.25 in last year’s third quarter.

Net oil-equivalent production of 1.18 million barrels per day in third quarter 2022 was up 49,000 barrels per day from a year earlier. The increase was primarily due to net production increases in the Gulf of Mexico, due to the absence of third quarter 2021 weather impacts, and in the Permian Basin. The net liquids component of oil-equivalent production in third quarter 2022 increased 6 percent to 891,000 barrels per day, and net natural gas production was 1.71 billion cubic feet per day, similar to last year’s third quarter.

International Upstream


Three Months
Ended September 30

Nine Months
Ended September 30

Millions of dollars

2022

2021

2022

2021

Earnings*

$

5,909

$

3,173

$

14,794

$

6,314

*Includes foreign currency effects

$

440

$

285

$

899

$

311

International upstream operations earned $5.91 billion in third quarter 2022, compared with $3.17 billion a year ago. The increase in earnings was primarily due to higher realizations, partially offset by lower sales volumes. Foreign currency effects had a favorable impact on earnings of $155 million compared to last year’s third quarter.

The average sales price for crude oil and natural gas liquids in third quarter 2022 was $89 per barrel, up from $68 a year earlier. The average sales price of natural gas was $10.36 per thousand cubic feet in the third quarter, up from $6.28 in last year’s third quarter.

Net oil-equivalent production of 1.85 million barrels per day in third quarter 2022 was down 56,000 barrels per day from third quarter 2021. The decrease was primarily due to the absence of production following expiration of the Erawan concession in Thailand and Rokan concession in Indonesia, partially offset by the absence of third quarter 2021 planned turnaround impacts at Tengizchevroil. The net liquids component of oil-equivalent production decreased 11 percent to 816,000 barrels per day in third quarter 2022, while net natural gas production increased 4 percent to 6.21 billion cubic feet per day compared to last year’s third quarter.

DOWNSTREAM

U.S. Downstream


Three Months
Ended September 30

Nine Months
Ended September 30

Millions of dollars


2022


2021


2022


2021

Earnings

$

1,288

$

1,083

$

4,214

$

1,729

U.S. downstream operations reported earnings of $1.29 billion in third quarter 2022, compared with earnings of $1.08 billion a year earlier. The increase was mainly due to higher margins on refined product sales, partially offset by lower earnings from the 50 percent-owned Chevron Phillips Chemical Company and higher operating expenses that were largely associated with planned turnarounds.

Refinery crude oil input in third quarter 2022 decreased 13 percent to 779,000 barrels per day from the year-ago period, primarily due to planned turnarounds.

Refined product sales of 1.25 million barrels per day were up 5 percent from the year-ago period, mainly due to higher renewable fuel sales following the Renewable Energy Group, Inc. acquisition and higher jet fuel demand as restrictions from the pandemic continue to ease.

International Downstream


Three Months
Ended September 30

Nine Months
Ended September 30

Millions of dollars

2022

2021

2022

2021

Earnings*

$

1,242

$

227

$

2,169

$

425

*Includes foreign currency effects

$

179

$

123

$

347

$

183

International downstream operations reported earnings of $1.24 billion in third quarter 2022, compared with $227 million a year earlier. The increase was mainly due to higher margins on refined product sales and a $56 million favorable swing in foreign currency impacts compared to last year’s third quarter.

Refinery crude oil input of 651,000 barrels per day in third quarter 2022 increased 11 percent from the year-ago period as refinery runs increased due to higher demand.

Refined product sales of 1.44 million barrels per day in third quarter 2022 increased 4 percent from the year-ago period, mainly due to higher demand for jet fuel as restrictions from the pandemic continue to ease.

ALL OTHER


Three Months
Ended September 30

Nine Months
Ended September 30

Millions of dollars

2022


2021


2022


2021


Net Charges*

$

(606

)

$

(334

)

$

(2,069

)

$

(2,247

)

*Includes foreign currency effects

$

5


$

(103

)

$

(172

)

$

(148

)

All Other consists of worldwide cash management and debt financing activities, corporate administrative functions, insurance operations, real estate activities and technology companies.

Net charges in third quarter 2022 were $606 million, compared to $334 million a year earlier. The increase in net charges between periods was mainly due to the absence of third quarter 2021 favorable tax items and higher current quarter pension settlement expenses, partially offset by higher interest income from higher cash balances and lower debt interest expenses. Foreign currency effects decreased net charges by $108 million between periods.

CASH FLOW FROM OPERATIONS

Cash flow from operations in the first nine months of 2022 was $37.1 billion, compared with $19.7 billion in the first nine months of 2021. Excluding working capital effects, cash flow from operations in the first nine months of 2022 was $35.9 billion, compared with $21.2 billion in the first nine months of 2021.

CAPITAL AND EXPLORATORY EXPENDITURES

Capital and exploratory expenditures for the company’s consolidated entities (C&E) in the first nine months of 2022 were $8.2 billion, compared with $5.8 billion in the first nine months of 2021. Additionally, the company’s share of equity affiliate capital and exploratory expenditures (Affiliate C&E) was $2.4 billion in the first nine months of 2022 and $2.3 billion in the first nine months of 2021 and did not require cash outlays by the company. C&E for 2022 includes $0.8 billion of inorganic spend largely associated with the formation of the Bunge joint venture. The acquisition of Renewable Energy Group, Inc. is not included in the company’s C&E.

Chevron is one of the world’s leading integrated energy companies. We believe affordable, reliable and ever-cleaner energy is essential to achieving a more prosperous and sustainable world. Chevron produces crude oil and natural gas; manufactures transportation fuels, lubricants, petrochemicals and additives; and develops technologies that enhance our business and the industry. We are focused on lowering the carbon intensity in our operations and growing lower carbon businesses along with our traditional business lines. More information about Chevron is available at www.chevron.com.

NOTICE

Chevron’s discussion of third quarter 2022 earnings with security analysts will take place on Friday, October 28, 2022, at 8:00 a.m. PT. A webcast of the meeting will be available in a listen-only mode to individual investors, media, and other interested parties on Chevron’s website at www.chevron.com under the “Investors” section. Prepared remarks for today’s call, additional financial and operating information and other complementary materials will be available prior to the call at approximately 3:30 a.m. PT and located under “Events and Presentations” in the “Investors” section on the Chevron website.

As used in this news release, the term “Chevron” and such terms as “the company,” “the corporation,” “our,” “we,” “us” and “its” may refer to Chevron Corporation, one or more of its consolidated subsidiaries, or to all of them taken as a whole. All of these terms are used for convenience only and are not intended as a precise description of any of the separate companies, each of which manages its own affairs.

Please visit Chevron’s website and Investor Relations page at www.chevron.com and www.chevron.com/investors, LinkedIn: www.linkedin.com/company/chevron, Twitter: @Chevron, Facebook: www.facebook.com/chevron, and Instagram: www.instagram.com/chevron, where Chevron often discloses important information about the company, its business, and its results of operations.

Non-GAAP Financial Measures - This news release includes adjusted earnings/(loss), which reflect earnings or losses excluding significant non-operational items including impairment charges, write-offs, severance costs, gains on asset sales, unusual tax items, effects of pension settlements and curtailments, foreign currency effects and other special items. We believe it is useful for investors to consider this measure in comparing the underlying performance of our business across periods. The presentation of this additional information is not meant to be considered in isolation or as a substitute for net income (loss) as prepared in accordance with U.S. GAAP. A reconciliation to net income (loss) attributable to Chevron Corporation is shown in Attachment 6.

This news release also includes cash flow from operations excluding working capital, free cash flow and free cash flow excluding working capital. Cash flow from operations excluding working capital is defined as net cash provided by operating activities less net changes in operating working capital, and represents cash generated by operating activities excluding the timing impacts of working capital. Free cash flow is defined as net cash provided by operating activities less cash capital expenditures and generally represents the cash available to creditors and investors after investing in the business. Free cash flow excluding working capital is defined as net cash provided by operating activities excluding working capital less cash capital expenditures and generally represents the cash available to creditors and investors after investing in the business excluding the timing impacts of working capital. The company believes these measures are useful to monitor the financial health of the company and its performance over time. A reconciliation of cash flow from operations excluding working capital, free cash flow and free cash flow excluding working capital are shown in Attachment 3.

This news release also includes net debt ratio. Net debt ratio is defined as total debt less cash and cash equivalents and marketable securities as a percentage of total debt less cash and cash equivalents and marketable securities, plus Chevron Corporation stockholders’ equity, which indicates the company’s leverage, net of its cash balances. The company believes this measure is useful to monitor the strength of the company’s balance sheet. A reconciliation of net debt ratio is shown in Attachment 2.

Key Performance Indicators - Capital and exploratory expenditures (“C&E”) is a key performance indicator that provides the Company’s investment level in its consolidated companies. This metric includes additions to fixed asset and investment accounts along with exploration expense for its consolidated companies. Management uses this metric along with Affiliate C&E (as defined below) to manage allocation of capital across the company’s entire portfolio, funding requirements and ultimately shareholder distributions. The calculation of C&E is shown in Attachment 4.

Equity affiliate capital and exploratory expenditures (“Affiliate C&E”) is also a key performance indicator that provides the Company’s share of investments in its significant equity affiliate companies. This metric includes additions to fixed asset and investment accounts along with exploration expense in the equity affiliate companies’ financial statements. Management uses this metric to assess possible funding needs and/or shareholder distribution capacity of the company’s equity affiliate companies. Together with C&E, management also uses Affiliate C&E to manage allocation of capital across the company’s entire portfolio, funding requirements and ultimately shareholder distributions. Affiliate C&E is in Attachment 4.

CAUTIONARY STATEMENTS RELEVANT TO FORWARD-LOOKING INFORMATION FOR THE PURPOSE OF “SAFE HARBOR” PROVISIONS OF THE PRIVATE SECURITIES LITIGATION REFORM ACT OF 1995

This news release contains forward-looking statements relating to Chevron’s operations and energy transition plans that are based on management’s current expectations, estimates and projections about the petroleum, chemicals and other energy-related industries. Words or phrases such as “anticipates,” “expects,” “intends,” “plans,” “targets,” “advances,” “commits,” “drives,” “aims,” “forecasts,” “projects,” “believes,” “approaches,” “seeks,” “schedules,” “estimates,” “positions,” “pursues,” “may,” “can,” “could,” “should,” “will,” “budgets,” “outlook,” “trends,” “guidance,” “focus,” “on track,” “goals,” “objectives,” “strategies,” “opportunities,” “poised,” “potential,” “ambitions,” “aspires” and similar expressions are intended to identify such forward-looking statements. These statements are not guarantees of future performance and are subject to certain risks, uncertainties and other factors, many of which are beyond the company’s control and are difficult to predict. Therefore, actual outcomes and results may differ materially from what is expressed or forecasted in such forward-looking statements. The reader should not place undue reliance on these forward-looking statements, which speak only as of the date of this news release. Unless legally required, Chevron undertakes no obligation to update publicly any forward-looking statements, whether as a result of new information, future events or otherwise.

Among the important factors that could cause actual results to differ materially from those in the forward-looking statements are: changing crude oil and natural gas prices and demand for the company’s products, and production curtailments due to market conditions; crude oil production quotas or other actions that might be imposed by the Organization of Petroleum Exporting Countries and other producing countries; technological advancements; changes to government policies in the countries in which the company operates; public health crises, such as pandemics (including coronavirus (COVID-19)) and epidemics, and any related government policies and actions; disruptions in the company’s global supply chain, including supply chain constraints and escalation of the cost of goods and services; changing economic, regulatory and political environments in the various countries in which the company operates; general domestic and international economic, market and political conditions, including the military conflict between Russia and Ukraine and the global response to such conflict; changing refining, marketing and chemicals margins; actions of competitors or regulators; timing of exploration expenses; timing of crude oil liftings; the competitiveness of alternate-energy sources or product substitutes; development of large carbon capture and offset markets; the results of operations and financial condition of the company’s suppliers, vendors, partners and equity affiliates, particularly during the COVID-19 pandemic; the inability or failure of the company’s joint-venture partners to fund their share of operations and development activities; the potential failure to achieve expected net production from existing and future crude oil and natural gas development projects; potential delays in the development, construction or start-up of planned projects; the potential disruption or interruption of the company’s operations due to war, accidents, political events, civil unrest, severe weather, cyber threats, terrorist acts, or other natural or human causes beyond the company’s control; the potential liability for remedial actions or assessments under existing or future environmental regulations and litigation; significant operational, investment or product changes undertaken or required by existing or future environmental statutes and regulations, including international agreements and national or regional legislation and regulatory measures to limit or reduce greenhouse gas emissions; the potential liability resulting from pending or future litigation; the company’s future acquisitions or dispositions of assets or shares or the delay or failure of such transactions to close based on required closing conditions; the potential for gains and losses from asset dispositions or impairments; government mandated sales, divestitures, recapitalizations, taxes and tax audits, tariffs, sanctions, changes in fiscal terms or restrictions on scope of company operations; foreign currency movements compared with the U.S. dollar; higher inflation and related impacts; material reductions in corporate liquidity and access to debt markets; the receipt of required Board authorizations to implement capital allocation strategies, including future stock repurchase programs and dividend payments; the effects of changed accounting rules under generally accepted accounting principles promulgated by rule-setting bodies; the company’s ability to identify and mitigate the risks and hazards inherent in operating in the global energy industry; and the factors set forth under the heading “Risk Factors” on pages 20 through 25 of the company's 2021 Annual Report on Form 10-K and in subsequent filings with the U.S. Securities and Exchange Commission. Other unpredictable or unknown factors not discussed in this news release could also have material adverse effects on forward-looking statements.

Attachment 1

CHEVRON CORPORATION - FINANCIAL REVIEW

(Millions of Dollars, Except Per-Share Amounts)

(unaudited)


CONSOLIDATED STATEMENT OF INCOME


Three Months
Ended September 30

Nine Months
Ended September 30

REVENUES AND OTHER INCOME


2022


2021


2022


2021

Sales and other operating revenues

$

63,508

$

42,552

$

181,194

$

109,745

Income (loss) from equity affiliates


2,410


1,647


6,962


4,000

Other income (loss)


726


511


1,623


591

Total Revenues and Other Income


66,644


44,710


189,779


114,336

COSTS AND OTHER DEDUCTIONS


Purchased crude oil and products


38,090


23,834


110,742


62,031

Operating expenses *


7,593


6,110


21,430


18,564

Exploration expenses


116


158


521


357

Depreciation, depletion and amortization


4,201


4,304


11,555


13,112

Taxes other than on income


1,707


2,075


5,272


5,061

Interest and debt expense


128


174


393


557

Total Costs and Other Deductions


51,835


36,655


149,913


99,682

Income (Loss) Before Income Tax Expense


14,809


8,055


39,866


14,654

Income tax expense (benefit)


3,571


1,940


10,636


4,047

Net Income (Loss)


11,238


6,115


29,230


10,607

Less: Net income (loss) attributable to noncontrolling interests


7


4


118


37

NET INCOME (LOSS) ATTRIBUTABLE TO

CHEVRON CORPORATION

$

11,231

$

6,111

$

29,112

$

10,570


PER SHARE OF COMMON STOCK


Net Income (Loss) Attributable to Chevron Corporation


- Basic

$

5.81

$

3.19

$

15.02

$

5.52

- Diluted

$

5.78

$

3.19

$

14.95

$

5.51

Weighted Average Number of Shares Outstanding (000's)


- Basic


1,932,238


1,918,006


1,938,524


1,916,174

- Diluted


1,940,002


1,921,095


1,947,201


1,919,666

Note: Shares outstanding (excluding 14 million associated with Chevron’s Benefit Plan Trust) were 1,919 million and 1,916 million at September 30, 2022 and December 31, 2021, respectively.

EARNINGS BY MAJOR OPERATING AREA

Three Months
Ended September 30

Nine Months
Ended September 30


2022


2021


2022


2021


Upstream


United States

$

3,398


$

1,962


$

10,004


$

4,349


International


5,909


3,173


14,794


6,314


Total Upstream


9,307


5,135


24,798


10,663


Downstream


United States


1,288


1,083


4,214


1,729


International


1,242


227


2,169


425


Total Downstream


2,530


1,310


6,383


2,154


All Other


(606

)


(334

)


(2,069

)


(2,247

)

NET INCOME (LOSS) ATTRIBUTABLE TO

CHEVRON CORPORATION

$

11,231


$

6,111


$

29,112


$

10,570


* Includes operating expense, selling, general and administrative expense, and other components of net periodic benefit costs


Contacts

Randy Stuart -- +1 832-854-3844


Read full story here

Led by experienced industry veterans, board, and industry advisory, the new company’s platform accelerates Commercial EV Fleet Adoption and Customer ROI

BOULDER, Colo.--(BUSINESS WIRE)--Rhythmos, an electric vehicle (EV) and commercial fleet charging and grid optimization technology company, was launched today by an experienced team of electricity industry veterans with a mission to drive intelligent energy delivery and use for a world that moves on electricity. The company’s Rhythmos Algorithmic Optimization System (AOS) enables utilities, EV fleet owners, and other participants in the electricity ecosystem to extract dormant value while transitioning to clean, renewable energy and decarbonized transportation.


“The U.S. needs an estimated $2.1 trillion in capital investment by 2030 to put us on a path to a near-zero emissions economy – and a huge part of that investment will go to expand the nation’s electrical system to accommodate the increased electrical load due to vehicle electrification (both passenger and fleet),” said Kenneth Munson, CEO of Rhythmos. Rhythmos has built a platform to help stakeholders across the entire energy ecosystem extract dormant value while facilitating a cost-efficient transition from fossil fuels to clean, renewable energy and decarbonized transportation.

Sophisticated Technology

The Rhythmos AOS platform is the foundation for the company’s advanced, intelligent technology solutions that co-optimize the entire grid ecosystem to extract maximum benefits from EV deployments for customers. At the same time, the technology minimizes grid impacts and wholesale energy costs of EV charging and operations for utilities, energy retailers, and aggregators. Leveraging a long history in predictive analytics, Rhythmos, formerly GridCure, was reimagined and restructured to capitalize on emerging fleet electrification challenges with a specific emphasis on managing the intersection of energy markets, fleets, and utilities.

The technology opens up a tremendous opportunity to drive the transformation from the ends: Linking wholesale markets, bulk power generators, utility transmission and distribution systems, EV fleet operators, and even individual EV owners together to drive efficiencies, optimize demand, enable intelligent fleet charging/discharging planning and operations, and create incentives for all participants to play an active role in the transition while sharing in its economic benefits.

“The Rhythmos AOS platform will serve as a seamless integration point allowing all participants on the grid to partner with each other, turning traditional grid liabilities into assets and participants into partners,” Munson said.

Experienced Leadership

The company’s leadership team brings unparalleled experience in running one of the most innovative mobility commercialization collaboratives in the world, as well as expansive experience in virtually every group within one of the US’s largest and most innovative municipal utilities, encompassing modernization and technology innovation, data science, systems operations, system planning, distribution operations engineering, grid-edge battery storage, and demand response program design.

Leading the new company as CEO, Munson brings decades of experience as an executive at innovative companies developing advanced energy and grid-edge technologies. Leading the Company’s Product efforts is Jeff Berkheimer as Senior Vice President, and Mark Rawson, who is leading Strategy and Partnership as Senior Vice President.

The company also has assembled a visionary Board and Industry Advisory Council to guide its work, enabling the transition of the electricity system to one that fully supports the adoption of electric transportation and distributed generation.

The board and industry council include experts that give the company unparalleled counsel in connected vehicles, mobility, vehicle electrification rate design, carbon-reduction policy, automotive and utility innovation, and finance to help guide our roadmap and vision. Together with the utility industry and grid technology executives at the company, these expert advisors provide Rhythmos with decades of deep knowledge from which to draw as it looks to lead change across the grid and EV ecosystem. Rhythmos also draws on the tremendous support from its lead Blackhorn Ventures, as well as BDC Capital, UPC Capital Ventures, and many others.

The company’s board includes:

  • Mark Loch, Operating Partner, Blackhorn Ventures. Loch is a senior adviser for companies, investors, and institutions in the Front Range, tackling the world’s energy and resource sustainability and access challenges. He is Managing Director Emeritus at McKinsey & Company.
  • Logan Grizzel, Partner, MUUS Climate Partners. Grizzel is responsible for deal sourcing, due diligence and execution, and supporting the MCP team and portfolio companies. Before joining MUUS Climate Partners, Logan was a Partner and CTO at Blackhorn Ventures. Logan spent time with Toyota, learning about working on the electrified vehicle product planning, marketing, and strategic research for EVs, PHEVs, and Fuel Cells, powertrains, and vehicles.
  • Dan Grossman, Board Member and Leadership Advisor, Automotive and Shared Mobility. Grossman has been at the forefront of the automotive and mobility sectors for more than 15 years. He was a pioneer in the car-sharing space with Zipcar as a start-up, created General Motors’ Maven mobility division, and served as Ford Motor Company’s Global Vice President of Microtransit.
  • Neetika Sathe, Vice President, Green Energy, and Technology (GRE&T) Centre at Alectra. As a Canada Cleane50 Award recipient, Sathe leads innovation in the energy industry for the GRE&T Center, which under her leadership, has launched many innovative initiatives that are transforming the energy sector.

The Industry Advisory Council for Rhythmos includes:

  • Paul De Martini, Managing Partner, Newport Consulting. De Martini is a leading strategic advisor on the business, policy, and technology dimensions of a more distributed power system. His global clients include utilities, market operators, regulators, and government agencies.
  • Henry Bzeih, Global Chief Strategy Officer, CTO Automotive & Transportation, and Head, Transportation Business Line at Microsoft. As global CTO and Lead Strategist for the Mobility, Automotive & Transportation industries, Bzeih’s primary focus is to lead the industry's global Three Horizon strategy. His automotive technology executive career spans 28 years in the automotive and technology sectors.

“We are extremely fortunate to have this caliber of experienced executives and advisors playing such fundamental roles at Rhythmos from day one,” Munson said. “We have a strong vision for the future. Rhythmos comes into the market with the technology and expertise to match that vision and deliver value and positive change that will benefit our customers, company, and planet.”

About Rhythmos

Rhythmos develops advanced technology that optimizes the entire electric mobility ecosystem, enabling the transition to a decarbonized power grid based on distributed energy resources as primary service providers. Our Rhythmos Algorithmic Optimization System (AOS) platform uses advanced machine learning and data analytics to optimize grid performance, considering EV fleet owner operational requirements, existing utility tariffs and rates, electric utility infrastructure capacity and grid constraints, wholesale energy market pricing, and more. By approaching optimization from this end-to-end ecosystem perspective, the Rhythmos AOS extracts the dormant value for all participants in the energy ecosystem, something traditional point solutions cannot identify and capture. Based in Boulder, CO, Rhythmos is at the forefront of solving a $2.1 trillion problem and facilitating a rapid and cost-efficient transition from fossil fuels to clean, renewable energy and decarbonized transportation. Learn more at Rhythmos For media inquiries, contact This email address is being protected from spambots. You need JavaScript enabled to view it..


Contacts

Elaine Wheatley
This email address is being protected from spambots. You need JavaScript enabled to view it.

  • Grew earnings and cash flow from operating activities to $19.7 billion and $24.4 billion, respectively, as strong volume performance, including record refining volumes¹, rigorous cost control and higher natural gas realizations more than offset lower crude realizations and weaker industry refining margins
  • Achieved best-ever quarterly refining throughput in North America and highest globally since 2008¹
  • Delivered strong quarterly oil and gas production, including record Permian production of nearly 560,000 oil-equivalent barrels per day to better serve demand; year-on-year, total production increased 50,000 oil-equivalent barrels per day
  • Signed largest-of-its-kind commercial agreement to capture and permanently store up to 2 million metric tons of CO2 emissions per year
  • Declared fourth-quarter dividend of $0.91 per share, an increase of $0.03 per share; paying out $15 billion in aggregate for the year

IRVING, Texas--(BUSINESS WIRE)--Exxon Mobil Corporation (NYSE:XOM):


Results Summary


3Q22

2Q22

Change

vs

2Q22

3Q21

Change

vs

3Q21

Dollars in millions (except per share data)

YTD

2022

YTD

2021

Change

vs

YTD 2021

19,660

17,850

+1,810

6,750

+12,910

Earnings (U.S. GAAP)

42,990

14,170

+28,820

18,682

17,551

+1,131

6,755

+11,927

Earnings Excluding Identified Items

45,066

14,218

+30,848


4.68

4.21

+0.47

1.57

+3.11

Earnings Per Common Share ²

10.17

3.31

+6.86

4.45

4.14

+0.31

1.58

+2.87

Earnings Excl. Identified Items Per Common Share ²

10.66

3.33

+7.33


5,728

4,609

+1,119

3,851

+1,877

Capital and Exploration Expenditures

15,241

10,787

+4,454

Exxon Mobil Corporation today announced third-quarter 2022 earnings of $19.7 billion, or $4.68 per share assuming dilution. Third-quarter results included net favorable identified items of nearly $1 billion associated with the completion of the XTO Energy Canada and Romania Upstream affiliate divestments and one-time benefits from tax and other reserve adjustments, partly offset by impairments. Capital and exploration expenditures were $5.7 billion in the third quarter, bringing year-to-date 2022 investments to $15.2 billion, on track with full-year guidance of $21 billion to $24 billion.

Our strong third-quarter results reflect the hard work of our people to invest in and build businesses critical to meeting the demand we see today,” commented Darren Woods, chairman and chief executive officer. "We all understand how important our role is in producing the energy and products the world needs, and third-quarter results reflect our commitment to that objective."

The investments we've made, even through the pandemic, enabled us to increase production to address the needs of consumers. Rigorous cost control and growth of higher-margin petroleum and chemical products also contributed to earnings and cash flow growth in the quarter. At the same time, we are expanding our Low Carbon Solutions business with the signing of the largest-of-its-kind customer contract to capture and permanently store carbon dioxide, demonstrating our ability to offer competitive emission-reduction services to large industrial customers around the world,” concluded Woods.

¹ Best-ever quarterly refining throughput in North America and highest globally since 2008, both based on current refinery circuit

² Assuming dilution

Financial Highlights

  • Third-quarter earnings were $19.7 billion compared with $17.9 billion in the second quarter of 2022. Excluding identified items, earnings of $18.7 billion were up $1.1 billion versus the prior quarter as higher natural gas realizations, record throughput in Energy Products, and continued cost control, were partially offset by lower crude realizations and moderating industry refining margins.
  • Cash increased by $11.6 billion in the third quarter with free cash flow of $22 billion. Shareholder distributions were $8.2 billion for the quarter, including $3.7 billion of dividends and $4.5 billion of share repurchases, bringing year-to-date repurchases to $10.5 billion, consistent with the company's plan to repurchase up to $30 billion of shares through 2023.
  • The Corporation declared a fourth-quarter dividend of $0.91 per share, payable on December 9th. The increase of $0.03 per share reflects confidence in our strategy, businesses performance, and financial strength, and marks 40 consecutive years of annual dividend growth. A reliable and growing dividend shows the company's commitment to return profits to shareholders, of which approximately 40% are individual investors.
  • Net-debt-to-capital ratio improved to about 7%, reflecting a period-end cash balance of $30.5 billion. The debt-to-capital ratio is now 19%, just below the low-end of the company's target range.
  • Asset sales and divestments resulted in $2.7 billion of cash proceeds during the quarter, bringing year-to-date proceeds to nearly $4 billion.

Leading the Drive to Net Zero

Carbon Capture and Storage

  • ExxonMobil and CF Industries, a leading global manufacturer of hydrogen and nitrogen products, have entered into the largest-of-its-kind commercial agreement to capture and permanently store up to 2 million metric tons of carbon dioxide (CO2) emissions annually from CF Industries' manufacturing complex in Louisiana. The project, which is scheduled to start up in early 2025, supports Louisiana’s objective of net zero CO2 emissions by 2050.

    As part of the project, ExxonMobil signed an agreement with EnLink Midstream to use EnLink’s transportation network to deliver CO2 to secure, permanent, underground geologic storage. The 2 million metric tons of captured emissions is the equivalent of replacing approximately 700,000 gasoline-powered cars with electric vehicles.

    This landmark project represents large-scale, real-world progress on the journey to decarbonize the global economy. Carbon capture and storage is a safe, proven technology that can enable some of the highest-emitting sectors to meaningfully reduce their emissions, and the company expects this technology to play an important role in the energy transition.

    Constructive policy such as the U.S. Inflation Reduction Act will provide support to carbon capture and storage projects like this, promoting the development of low-carbon energy in the United States. Carbon capture and sequestration provisions provide incentives that make CO2 capture more economic, including for less concentrated CO2 streams and for those streams in areas without close proximity to permanent storage.
  • The Bureau of Land Management approved a proposal to sequester carbon deep under federal land in Lincoln and Sweetwater counties in Wyoming. This is the first project of its kind to be approved on land managed by the Bureau of Land Management and, once completed, will provide the opportunity for permanent underground storage of CO2 that is generated as a by-product of helium and natural gas production at the ExxonMobil Shute Creek Plant.

Biofuels and Hydrogen

  • Imperial Oil Ltd., an ExxonMobil majority-owned affiliate, announced a long-term contract through which Air Products will supply lower-carbon hydrogen by pipeline from its hydrogen plant, currently under construction in Edmonton, to Imperial's Strathcona refinery. The lower-carbon hydrogen will be used in production of renewable diesel that substantially reduces greenhouse gas emissions relative to conventional production. The Strathcona refinery project is expected to produce approximately 20,000 barrels per day of renewable diesel, which could reduce emissions in the Canadian transportation sector by about 3 million metric tons per year, the equivalent to taking approximately 650,000 passenger vehicles off the road1.

1 Estimates based on United States Environmental Protection Agency Greenhouse Gas Equivalencies Calculator

EARNINGS AND VOLUME SUMMARY BY SEGMENT

Upstream

3Q22

2Q22

3Q21

Dollars in millions (unless otherwise noted)

YTD 2022

YTD 2021


Earnings/(Loss) (U.S. GAAP)


3,110

3,749

869

United States

9,235

1,895

9,309

7,622

3,082

Non-U.S.

19,043

7,795

12,419

11,371

3,951

Worldwide

28,278

9,690


Earnings/(Loss) Excluding Identified Items


3,110

3,450

869

United States

8,936

1,895

8,731

7,622

3,082

Non-U.S.

21,720

7,795

11,841

11,072

3,951

Worldwide

30,656

9,690


3,716

3,732

3,665

Production (koebd)

3,708

3,677

  • Upstream third-quarter 2022 earnings were $12.4 billion compared to $11.4 billion in the second quarter. Excluding identified items, earnings were $11.8 billion, an increase of $0.8 billion from the previous quarter. Gas realizations increased 22% on European supply concerns and efforts to build inventory ahead of winter, more than offsetting the impact of decreasing crude realizations, which were down 12% on modest supply increases. Earnings also benefited from higher volumes and improved mix from growth in the company's advantaged assets in Guyana and the Permian.
  • Oil-equivalent production in the third quarter was 3.7 million barrels per day. Absent divestments and the Russia exit impact, sequential quarter volume growth was more than 50,000 oil-equivalent barrels per day.
  • The Permian delivered record production in the quarter of nearly 560,000 oil-equivalent barrels a day.
  • Offshore Guyana quarterly average gross production increased to nearly 360,000 oil-equivalent barrels per day, with Liza Phase 1 and 2 production exceeding design capacity by more than 15,000 barrels per day. In addition, two new discoveries were announced in the Stabroek block, adding to the company's extensive portfolio of development opportunities.
  • Earnings excluding identified items increased $7.9 billion relative to the third quarter of 2021. This improvement was driven by a 172% increase in natural gas realizations and an increase of nearly 40% in crude realizations. Oil-equivalent production grew approximately 50,000 barrels per day despite a reduction of 75,000 barrels per day from divestments.
  • Year-to-date earnings excluding identified items were $30.7 billion, an increase of $21 billion versus the first nine months of 2021 on higher crude and natural gas realizations. Excluding impacts from divestments, oil-equivalent production grew nearly 90,000 barrels per day.
  • Earlier this month, first LNG production was achieved from Mozambique’s Coral South Floating LNG, contributing new supply amid growing global demand.
  • The company completed the sales of XTO Energy Canada and the Romania Upstream affiliate, resulting in earnings of $0.6 billion and more than $2 billion in cash proceeds during the quarter. In addition, an agreement was announced with Green Gate Resources E, LLC, for the sale of ExxonMobil's interest in the Aera oil-production operation in California, which is expected to close in the fourth quarter.

Energy Products

3Q22

2Q22

3Q21

Dollars in millions (unless otherwise noted)

YTD 2022

YTD 2021


Earnings/(Loss) (U.S. GAAP)


3,008

2,655

479

United States

6,152

(31)

2,811

2,617

50

Non-U.S.

4,744

(1,217)

5,819

5,273

529

Worldwide

10,896

(1,248)


Earnings/(Loss) Excluding Identified Items


3,008

2,655

479

United States

6,152

(31)

2,811

2,617

50

Non-U.S.

4,744

(1,217)

5,819

5,273

529

Worldwide

10,896

(1,248)


5,537

5,310

5,302

Energy Products Sales (kbd)

5,321

5,049

  • Energy Products third-quarter 2022 earnings totaled $5.8 billion compared to $5.3 billion in the second quarter. Industry refining margins remained strong on high global diesel demand, yet declined 30% from second quarter levels due to higher refinery runs and flat U.S. gasoline demand. The impact of lower industry refining margins was partially offset by higher aromatics, marketing and trading margins. In addition, record throughput1 on strong reliability, improved product yields, and lower turnaround activity also contributed to the earnings improvement.
  • Earnings increased $5.3 billion compared to the third quarter of 2021 due to stronger industry refining margins, positive derivative mark-to-market effects and higher volumes.
  • Year-to-date earnings of $10.9 billion compared to a loss of $1.2 billion in the same period last year, driven by stronger industry refining margins and increased volumes on strong reliability and lower scheduled maintenance.
  • Third-quarter refining throughput was 4.2 million barrels per day, up 177,000 barrels from the second quarter. This reflects best ever quarterly refining throughput in North America and the highest globally since 20081.

1 Best ever quarterly refining throughput in North America and highest globally since 2008, both based on current refinery circuit

Chemical Products

3Q22

2Q22

3Q21

Dollars in millions (unless otherwise noted)

YTD 2022

YTD 2021


Earnings/(Loss) (U.S. GAAP)


635

625

1,121

United States

2,030

2,923

177

450

907

Non-U.S.

1,263

2,695

812

1,076

2,027

Worldwide

3,293

5,618


Earnings/(Loss) Excluding Identified Items


635

625

1,121

United States

2,030

2,923

177

450

907

Non-U.S.

1,263

2,695

812

1,076

2,027

Worldwide

3,293

5,618


4,680

4,811

4,814

Chemical Products Sales (kt)

14,509

14,309

  • Chemical Products third-quarter 2022 earnings were $0.8 billion compared to $1.1 billion in the second quarter. Solid earnings reflected reliable operations and cost discipline, partially offsetting the negative impact on volumes and margins from bottom-of-cycle conditions in Asia Pacific and softening demand in Europe and North America, with regional pricing moving closer to global parity. Record quarterly sales volume for performance polyethylene helped upgrade product mix, which served as a partial offset to lower volumes.
  • Earnings were $1.2 billion lower compared to third-quarter 2021 on weaker industry margins and lower sales, reflecting softening market conditions.
  • Year-to-date earnings totaled $3.3 billion compared to $5.6 billion in the first nine months of 2021, driven by lower margins on rising feed and energy costs, higher project and planned maintenance expenses, and unfavorable foreign exchange effects.

Specialty Products

3Q22

2Q22

3Q21

Dollars in millions (unless otherwise noted)

YTD 2022

YTD 2021


Earnings/(Loss) (U.S. GAAP)


306

232

247

United States

784

689

456

185

592

Non-U.S.

871

1,454

762

417

839

Worldwide

1,655

2,143


Earnings/(Loss) Excluding Identified Items


306

232

247

United States

784

689

456

185

592

Non-U.S.

871

1,454

762

417

839

Worldwide

1,655

2,143


1,917

2,100

1,896

Specialty Products Sales (kt)

6,024

5,832

  • Specialty Products third-quarter 2022 earnings were $0.8 billion compared with $0.4 billion in the second quarter. The strong quarterly performance was driven by improved margins reflecting tight market conditions, partly offset by lower sales from a reliability event resolved within the quarter.
  • Compared to the same quarter last year, earnings declined $0.1 billion. Margins were robust, but down year-on-year reflecting a higher feed cost environment.
  • Year-to-date earnings of $1.7 billion decreased from $2.1 billion in the same period last year, primarily due to lower margins on higher feed costs and energy prices, partly offset by higher sales.

Corporate and Financing

3Q22

2Q22

3Q21

Dollars in millions (unless otherwise noted)

YTD 2022

YTD 2021

(152)

(286)

(596)

Earnings/(Loss) (U.S. GAAP)

(1,132)

(2,033)

(552)

(286)

(591)

Earnings/(Loss) Excluding Identified Items

(1,434)

(1,985)

  • Corporate and Financing reported net charges of $0.2 billion in the third quarter of 2022 compared to $0.3 billion in the second quarter. Excluding favorable identified items of $0.4 billion related to tax and other reserve adjustments, net charges were up $0.3 billion, reflecting the absence of the prior quarter's favorable one-time tax impacts.
  • Net charges excluding identified items of $0.6 billion in the third quarter of 2022 were in line with the same quarter of 2021.
  • Year-to-date net charges excluding identified items of $1.4 billion were down $0.6 billion from last year, mainly due to decreased pension-related expenses and lower financing costs.

CASH FLOW FROM OPERATIONS AND ASSET SALES EXCLUDING WORKING CAPITAL

3Q22

2Q22

3Q21

Dollars in millions

YTD 2022

YTD 2021

20,198

18,574

6,942

Net income/(loss) including noncontrolling interests

44,522

14,519

5,642

4,451

4,990

Depreciation and depletion (includes impairments)

18,976

14,946

1,667

(2,747)

659

Changes in operational working capital

6

2,232

(3,082)

(315)

(500)

Other

(4,328)

(692)

24,425

19,963

12,091

Cash Flow from Operating Activities (U.S. GAAP)

59,176

31,005


2,682

939

18

Proceeds associated with asset sales

3,914

575

27,107

20,902

12,109

Cash Flow from Operations and Asset Sales

63,090

31,580


(1,667)

2,747

(659)

Changes in operational working capital

(6)

(2,232)

25,440

23,649

11,450

Cash Flow from Operations and Asset Sales excluding Working Capital

63,084

29,348

FREE CASH FLOW


3Q22

2Q22

3Q21

Dollars in millions

YTD 2022

YTD 2021

24,425

19,963

12,091

Cash Flow from Operating Activities (U.S. GAAP)

59,176

31,005


(4,876)

(3,837)

(2,840)

Additions to property, plant and equipment

(12,624)

(7,987)

(272)

(226)

(442)

Additional investments and advances

(915)

(1,055)

88

60

210

Other investing activities including collection of advances

238

342

2,682

939

18

Proceeds from asset sales and returns of investments

3,914

575

22,047

16,899

9,037

Free Cash Flow

49,789

22,880

ExxonMobil will discuss financial and operating results and other matters during a webcast at 7:30 a.m. Central Time on October 28, 2022. To listen to the event or access an archived replay, please visit www.exxonmobil.com.

Cautionary Statement

Outlooks; projections; descriptions of strategic, operating, and financial plans and objectives; statements of future ambitions and plans; and other statements of future events or conditions in this release, are forward-looking statements. Similarly, discussion of future carbon capture, biofuel and hydrogen plans to drive towards net zero emissions are dependent on future market factors, such as continued technological progress and policy support, and represent forward-looking statements. Actual future results, including financial and operating performance; total capital expenditures and mix, including allocations of capital to low carbon solutions; cost reductions and efficiency gains, including the ability to offset inflationary pressure; plans to reduce future emissions and emissions intensity; timing and outcome of projects to capture and store CO2, and produced biofuels; timing and outcome of hydrogen projects; cash flow, dividends and shareholder returns, including the timing and amounts of share repurchases; future debt levels and credit ratings; business and project plans, timing, costs, capacities and returns; and resource recoveries and production rates could differ materially due to a number of factors. These include global or regional changes in the supply and demand for oil, natural gas, petrochemicals, and feedstocks and other market conditions that impact prices and differentials for our products; government policies supporting lower carbon investment opportunities such as the U.S. Inflation Reduction Act or policies limiting the attractiveness of future investment such as the European Solidarity Tax; variable impacts of trading activities on our margins and results each quarter; actions of competitors and commercial counterparties; the outcome of commercial negotiations, including final agreed terms and conditions; the ability to access debt markets; the ultimate impacts of COVID-19, including the effects of government responses on people and economies; reservoir performance, including variability and timing factors applicable to unconventional resources; the outcome of exploration projects and decisions to invest in future reserves; timely completion of development and other construction projects; final management approval of future projects and any changes in the scope, terms, or costs of such projects as approved; changes in law, taxes, or regulation including environmental regulations, trade sanctions, and timely granting of governmental permits and certifications; government policies and support and market demand for low carbon technologies; war, and other political or security disturbances; expropriations, seizure, or capacity, insurance or shipping limitations by foreign governments or laws; opportunities for potential investments or divestments and satisfaction of applicable conditions to closing, including regulatory approvals; the capture of efficiencies within and between business lines and the ability to maintain near-term cost reductions as ongoing efficiencies; unforeseen technical or operating difficulties and unplanned maintenance; the development and competitiveness of alternative energy and emission reduction technologies; the results of research programs and the ability to bring new technologies to commercial scale on a cost-competitive basis; and other factors discussed under Item 1A. Risk Factors of ExxonMobil’s 2021 Form 10-K.

Forward-looking and other statements regarding our environmental, social and other sustainability efforts and aspirations are not an indication that these statements are necessarily material to investors or requiring disclosure in our filing with the SEC. In addition, historical, current, and forward-looking environmental, social and sustainability-related statements may be based on standards for measuring progress that are still developing, internal controls and processes that continue to evolve, and assumptions that are subject to change in the future, including future rule-making.

Frequently Used Terms and Non-GAAP Measures

This press release includes cash flow from operations and asset sales. Because of the regular nature of our asset management and divestment program, the company believes it is useful for investors to consider proceeds associated with the sales of subsidiaries, property, plant and equipment, and sales and returns of investments together with cash provided by operating activities when evaluating cash available for investment in the business and financing activities. A reconciliation to net cash provided by operating activities for 2021 and 2022 periods is shown on page 7.

This press release also includes cash flow from operations and asset sales excluding working capital. The company believes it is useful for investors to consider these numbers in comparing the underlying performance of the company's business across periods when there are significant period-to-period differences in the amount of changes in working capital. A reconciliation to net cash provided by operating activities for 2021 and 2022 periods is shown on page 7.

This press release also includes earnings/(loss) excluding identified items, which are earnings/(loss) excluding individually significant non-operational events with an absolute corporate total earnings impact of at least $250 million in a given quarter. The earnings/(loss) impact of an identified item for an individual segment may be less than $250 million when the item impacts several periods or several segments. Earnings/(loss) excluding identified items does include non-operational earnings events or impacts that are below the $250 million threshold utilized for identified items. When the effect of these events is material in aggregate, it is indicated in analysis of period results as part of quarterly earnings press release and teleconference materials.


Contacts

Media Relations
972-940-6007


Read full story here

  • Coalition will apply for federal funding to create six-state hydrogen hub

WASHINGTON--(BUSINESS WIRE)--A newly formed coalition including major utility companies Dominion Energy, Duke Energy, Louisville Gas & Electric Company and Kentucky Utilities Company (LG&E and KU), Southern Company and the Tennessee Valley Authority (TVA), along with Battelle and others, announced today its plan to pursue federal financial support for a Southeast Hydrogen Hub. The coalition will respond to the recently announced funding opportunity from the U.S. Department of Energy (DOE), which includes $8 billion for regional hydrogen hubs and is part of the Infrastructure Investment and Jobs Act (IIJA).

Other members of the Southeast Hydrogen Hub coalition will include a growing list of hydrogen users from a variety of industries in Alabama, Georgia, Kentucky, North Carolina, South Carolina and Tennessee. The coalition expects its membership to grow as news of the opportunity spreads and as interest in hydrogen intensifies.

A hydrogen hub in the Southeastern U.S. is expected to bring robust economic development benefits to the region, and hydrogen is attractive as an energy resource because it has immediate potential to accelerate decarbonization in the Southeast and across all sectors of the U.S. economy – including transportation, which generates the largest share of greenhouse gas (GHG) emissions in the country.

Hydrogen also is a dispatchable energy source, meaning it can be turned on or off as needed, enabling power companies to add more intermittent renewable resources to the energy system. Hydrogen may be poised to play a major role in addressing climate change and could be essential for each coalition member to meet its stated carbon-reduction goals:

  • Dominion Energy: Achieve net-zero greenhouse gas emissions across Scopes 1, 2 and 3 for all electric and natural gas operations by 2050.
  • Duke Energy: Achieve net-zero carbon emissions from electricity generation by 2050. The company has interim carbon emissions targets of at least 50% reduction from electric generation by 2030 and 80% reduction by 2040.
  • Louisville Gas and Electric Company & Kentucky Utilities Company: Along with parent company, PPL, LG&E and KU has set a goal to achieve net-zero carbon emissions by 2050, with interim reduction targets of 70% from 2010 levels by 2035 and 80% by 2040.
  • Southern Company: Achieve net-zero greenhouse gas emissions across electric and natural gas operations by 2050.
  • TVA: Achieve 70% carbon reduction by 2030 and approximately 80% carbon reduction by 2035. Aspire to net-zero by 2050.

By working together, the coalition can focus on developing scalable, integrated projects at key locations across the entire Southeast in support of these carbon-reduction goals and encourage the broad-based development of a regional energy ecosystem that will allow members to deploy hydrogen as a decarbonization solution for customers and communities.

“Hydrogen will play an important role in our region’s clean energy transition and Dominion Energy’s path to net-zero emissions,” said Mark Webb, chief innovation officer of Dominion Energy. “From electricity and home heating to transportation and manufacturing, hydrogen will bring jobs, investment and clean energy to every sector of the Southeast U.S. economy. We’re excited to partner with all the members of the Southeast Hydrogen Hub coalition to deliver on this promise for our customers and the communities we serve.”

“Duke Energy is excited to work with our peers to explore this funding opportunity, which is vital to our industry-leading clean energy transformation for our customers and our communities,” said Swati Daji, Duke Energy senior vice president of enterprise strategy and planning. “A Southeast hydrogen hub will provide economic and workforce-development benefits that will extend well beyond the timeline for these projects. We are pleased to have Battelle’s leadership and experience on our side as we work together with the coalition to make this hub a reality.”

“LG&E and KU’s mission is to provide safe, reliable, sustainable, competitively priced energy to our customers,” said John Crockett, president of LG&E and KU. “Advancing a cleaner energy future is one of the core commitments of our sustainability strategy and we will continue to leverage our partnerships with industry, universities and national research institutions, to achieve our goals.”

“Southern Company views hydrogen as a powerful opportunity to provide an energy system that is abundant, affordable, reliable and resilient in a net-zero future,” said Chris Cummiskey, executive vice president, chief commercial officer and customer solutions officer, Southern Company. “With the nation’s leading utilities forming a solid, customer-centered foundation, the Southeast Hydrogen Hub promises to become a new catalyst for economic development and growth, while bringing broad, economywide decarbonization to the customers and communities we serve.”

“TVA is committed to our mission of service that makes life better for the people we serve,” said Dr. Joe Hoagland, vice president, TVA Innovation & Research. “As a member of the Southeast Hydrogen Hub coalition with Battelle and the Southeast’s premier energy providers, we are equipped and ready to maximize development of hydrogen as a much-needed alternative fuel. Hydrogen will be crucial for accelerating the transition to clean power so we can meet the demand for low-carbon energy throughout our region and across the country.”

“This team has a lot of strong players, and we think Battelle’s expertise and long history of operating large complex programs for the Department of Energy and other federal agencies can help uniquely position this team for success to address the critical issue of creating a clean energy future,” said Matt Vaughan, president of Battelle’s Applied Science and Technology.

About Dominion Energy

About 7 million customers in 15 states energize their homes and businesses with electricity or natural gas from Dominion Energy (NYSE: D), headquartered in Richmond, Va. The company is committed to safely providing reliable, affordable and sustainable energy and to achieving Net Zero emissions by 2050. Please visit DominionEnergy.com to learn more.

About Duke Energy

Duke Energy (NYSE: DUK), a Fortune 150 company headquartered in Charlotte, N.C., is one of America’s largest energy holding companies. Its electric utilities serve 8.2 million customers in North Carolina, South Carolina, Florida, Indiana, Ohio and Kentucky, and collectively own 50,000 megawatts of energy capacity. Its natural gas unit serves 1.6 million customers in North Carolina, South Carolina, Tennessee, Ohio and Kentucky. The company employs 28,000 people.

Duke Energy is executing an aggressive clean energy transition to achieve its goals of net-zero methane emissions from its natural gas business and at least a 50% carbon reduction from electric generation by 2030 and net-zero carbon emissions by 2050. The 2050 net-zero goals also include Scope 2 and certain Scope 3 emissions. In addition, the company is investing in major electric grid enhancements and energy storage, and exploring zero-emission power generation technologies such as hydrogen and advanced nuclear.

Duke Energy was named to Fortune’s 2022 “World’s Most Admired Companies” list and Forbes’ “America’s Best Employers” list. More information is available at duke-energy.com. The Duke Energy News Center contains news releases, fact sheets, photos and videos. Duke Energy’s illumination features stories about people, innovations, community topics and environmental issues. Follow Duke Energy on Twitter, LinkedIn, Instagram and Facebook.

About Louisville Gas & Electric Company and Kentucky Utilities Company

Louisville Gas and Electric Company and Kentucky Utilities Company, part of the PPL Corporation (NYSE: PPL) family of companies, are regulated utilities that serve more than 1.3 million customers and have consistently ranked among the best companies for customer service in the United States. LG&E serves 333,000 natural gas and 429,000 electric customers in Louisville and 16 surrounding counties. KU serves 566,000 customers in 77 Kentucky counties and five counties in Virginia. More information is available at www.lge-ku.com and www.pplweb.com.

About Southern Company

Southern Company (NYSE: SO) is a leading energy company serving 9 million customers through its subsidiaries. The company provides clean, safe, reliable and affordable energy through electric operating companies in three states, natural gas distribution companies in four states, a competitive generation company serving wholesale customers across America, a leading distributed energy infrastructure company, a fiber optics network and telecommunications services. Southern Company brands are known for excellent customer service, high reliability and affordable prices below the national average. For more than a century, we have been building the future of energy and developing the full portfolio of energy resources, including carbon-free nuclear, advanced carbon capture technologies, natural gas, renewables, energy efficiency and storage technology. Through an industry-leading commitment to innovation and a low-carbon future, Southern Company and its subsidiaries develop the customized energy solutions our customers and communities require to drive growth and prosperity. Our uncompromising values ensure we put the needs of those we serve at the center of everything we do and govern our business to the benefit of our world. Our corporate culture and hiring practices have been recognized nationally by the U.S. Department of Defense, G.I. Jobs magazine, DiversityInc, Black Enterprise, Fortune's "World's Most Admired Companies" list, Forbes and the Women's Choice Award. To learn more, visit www.southerncompany.com.

About TVA

The Tennessee Valley Authority is a corporate agency of the United States that provides electricity for business customers and local power companies serving nearly 10 million people in parts of seven southeastern states. TVA receives no taxpayer funding, deriving virtually all of its revenues from sales of electricity. In addition to operating and investing its revenues in its electric system, TVA provides flood control, navigation and land management for the Tennessee River system, and assists local power companies and state and local governments with economic development and job creation.

About Battelle

Every day, the people of Battelle apply science and technology to solving what matters most. At major technology centers and national laboratories around the world, Battelle conducts research and development, designs and manufactures products, and delivers critical services for government and commercial customers. Headquartered in Columbus, Ohio since its founding in 1929, Battelle serves the national security, health and life sciences, and energy and environmental industries. For more information, visit www.battelle.org.


Contacts

Battelle
Katy Delaney
Phone: 614-424-7208
This email address is being protected from spambots. You need JavaScript enabled to view it.

Dominion Energy
Persida Montanez
Phone: 919.819.1325
This email address is being protected from spambots. You need JavaScript enabled to view it.

Duke Energy
Jennifer Sharpe
Phone: 704.616.2013
This email address is being protected from spambots. You need JavaScript enabled to view it.

LG&E and KU Energy
24/7 Media Hotline
Phone: 502-627-4999

Southern Company
Demetrius Sherrod
Phone: 404-757-2961
This email address is being protected from spambots. You need JavaScript enabled to view it.

TVA
Ashton Caroline Davies
Phone: 615-815-8561
This email address is being protected from spambots. You need JavaScript enabled to view it.

Third Quarter Highlights include:


  • Reported third quarter revenues of $184.2 million, net income of $5.2 million and operating cash flow of $38.7 million;
  • Reduced net leverage ratio to 0.9x as of September 30, 2022 from 1.2x as of June 30, 2022;
  • Delivered third quarter Adjusted EBITDA of $35.0 million and free cash flow of $38.6 million; and
  • Announced earlier this quarter that its Board of Directors had renewed its share repurchase authorization for the Company to repurchase up to 5% of its total common shares outstanding over the next twelve months.

HOUSTON & CALGARY, Alberta--(BUSINESS WIRE)--Civeo Corporation (NYSE:CVEO) today reported financial and operating results for the third quarter ended September 30, 2022.

"In the third quarter of 2022, our focus remained on our strategic objectives of operating safely, generating free cash flow, maintaining our strong balance sheet and returning capital to shareholders through our buyback program. We continued to experience a recovery in Canadian lodge billed rooms as our customers increase activity in the oil sands region. We also experienced strong Canadian mobile camp results supporting pipeline construction activity. We now expect our mobile camps to remain active into 2023, moving their demobilization costs out of 2022 Adjusted EBITDA guidance," stated Bradley J. Dodson, Civeo's President and Chief Executive Officer.

Mr. Dodson concluded, "We are also proud to report that we achieved the significant milestone of reducing our net leverage ratio below 1.0x. This achievement would not be possible without the efforts of the entire Civeo team over the last few years. Our continued debt reduction provides us the flexibility to both weather the current market volatility and further evaluate other capital allocation opportunities."

Third Quarter 2022 Results

In the third quarter of 2022, Civeo generated revenues of $184.2 million and reported net income of $5.2 million, or $0.32 per diluted share. During the third quarter of 2022, Civeo produced operating cash flow of $38.7 million, Adjusted EBITDA of $35.0 million and free cash flow of $38.6 million.

By comparison, in the third quarter of 2021, Civeo generated revenues of $155.1 million and reported net income of $0.1 million, or $0.00 per diluted share. During the third quarter of 2021, Civeo produced operating cash flow of $33.9 million, Adjusted EBITDA of $26.2 million and free cash flow of $31.0 million.

Overall, the increase in revenues and Adjusted EBITDA in the third quarter of 2022 compared to the third quarter of 2021 was primarily driven by improved occupancy in the Canadian lodges and Australian villages as well as increased Canadian mobile camp activity, partially offset by the weaker Canadian and Australian dollars relative to the U.S. dollar.

Business Segment Results

(Unless otherwise noted, the following discussion compares the quarterly results for the third quarter of 2022 to the results for the third quarter of 2021.)

Canada

During the third quarter of 2022, the Canadian segment generated revenues of $103.0 million, operating income of $7.8 million and Adjusted EBITDA of $25.6 million, compared to revenues of $84.1 million, operating income of $6.1 million and Adjusted EBITDA of $19.8 million in the third quarter of 2021. Results from the third quarter of 2022 reflect the impact of a weakened Canadian dollar relative to the U.S. dollar, which decreased revenues and Adjusted EBITDA by $3.7 million and $0.9 million, respectively.

On a constant currency basis, the Canadian segment experienced a 27% period-over-period increase in revenues largely due to increased mobile camp activity and a 19% year-over-year increase in billed rooms, driven by increased customer activity as a result of the recovery of oil prices. Adjusted EBITDA for the Canadian segment increased 29% year-over-year primarily due to the aforementioned dynamics.

Australia

During the third quarter of 2022, the Australian segment generated revenues of $73.8 million, operating income of $5.9 million and Adjusted EBITDA of $16.9 million, compared to revenues of $65.1 million, operating income of $4.4 million and Adjusted EBITDA of $14.8 million in the third quarter of 2021. Results from the third quarter of 2022 reflect the impact of a weakened Australian dollar relative to the U.S. dollar, which decreased revenues and Adjusted EBITDA by $5.5 million and $1.3 million, respectively.

On a constant currency basis, the Australian segment experienced a 22% period-over-period increase in revenues, and a 14% year-over-year increase in Adjusted EBITDA. These improvements were driven by higher integrated services activity in Western Australia as well as a 7% year-over-year growth in billed rooms due to increased customer maintenance activity in the Bowen Basin.

U.S.

The U.S. segment generated revenues of $7.4 million, an operating loss of $1.7 million and negative Adjusted EBITDA of less than $0.0 million in the third quarter of 2022, compared to revenues of $5.9 million, an operating loss of $2.1 million and negative Adjusted EBITDA of $0.5 million in the third quarter of 2021. Revenues and Adjusted EBITDA increased year-over-year primarily due to the increased activity in our wellsite services and offshore businesses, partially offset by the sale of the West Permian lodge in the fourth quarter of 2021.

Financial Condition

As of September 30, 2022, Civeo had total liquidity of approximately $117.3 million, consisting of $108.9 million available under its revolving credit facilities and $8.4 million of cash on hand.

Civeo’s total debt outstanding on September 30, 2022 was $126.2 million, a $28.4 million decrease since June 30, 2022. The decrease consisted of $19.5 million in debt payments from cash flow generated by the business and favorable foreign currency translation of $8.9 million.

Civeo reduced its net leverage ratio to 0.9x as of September 30, 2022 from 1.2x as of June 30, 2022.

During the third quarter of 2022, Civeo invested $8.8 million in capital expenditures compared to $3.4 million invested during the third quarter of 2021. Capital expenditures in both periods were predominantly related to maintenance spending on the Company’s lodges and villages.

Full Year 2022 Guidance

For the full year of 2022, Civeo is increasing its previously provided revenue and Adjusted EBITDA guidance range to $675 million to $685 million and $110 million to $115 million, respectively. The Company is maintaining its full year 2022 capital expenditure guidance of $24 million to $29 million.

Conference Call

Civeo will host a conference call to discuss its third quarter 2022 financial results today at 11:00 a.m. Eastern time. This call is being webcast and can be accessed at Civeo's website at www.civeo.com. Participants may also join the conference call by dialing (877) 423-9813 in the United States or (201) 689-8573 internationally and using the conference ID 13733925#. A replay will be available after the call by dialing (844) 512-2921 in the United States or (412) 317-6671 internationally and using the conference ID 13733925#.

About Civeo

Civeo Corporation is a leading provider of hospitality services with prominent market positions in the Canadian oil sands and the Australian natural resource regions. Civeo offers comprehensive solutions for lodging hundreds or thousands of workers with its long-term and temporary accommodations and provides food services, housekeeping, facility management, laundry, water and wastewater treatment, power generation, communications systems, security and logistics services. Civeo currently operates a total of 27 lodges and villages in Canada, Australia and the U.S., with an aggregate of over 28,000 rooms. Civeo is publicly traded under the symbol CVEO on the New York Stock Exchange. For more information, please visit Civeo's website at www.civeo.com.

Forward Looking Statements

This news release contains forward-looking statements within the meaning of the Securities Act of 1933 and Section 21E of the Securities Exchange Act of 1934. Forward-looking statements are those that do not state historical facts and are, therefore, inherently subject to risks and uncertainties. The forward-looking statements herein include the statements regarding Civeo’s future plans and outlook, including guidance, current trends and liquidity needs, and ability to pay down debt are based on then current expectations and entail various risks and uncertainties that could cause actual results to differ materially from those expressed or implied by these forward-looking statements. Such risks and uncertainties include, among other things, risks associated with global health concerns and pandemics, including the COVID-19 pandemic, any increases in or severity of COVID-19 cases (including due to existing or new variants) and the risk that room occupancy may decline if our customers are limited or restricted in the availability of personnel who may become ill or be subjected to quarantine, risks associated with the general nature of the accommodations industry, risks associated with the level of supply and demand for oil, coal, iron ore and other minerals, including the level of activity, spending and developments in the Canadian oil sands, the level of demand for coal and other natural resources from, and investments and opportunities in, Australia, and fluctuations or sharp declines in the current and future prices of oil, natural gas, coal, iron ore and other minerals, risks associated with failure by our customers to reach positive final investment decisions on, or otherwise not complete, projects with respect to which we have been awarded contracts, which may cause those customers to terminate or postpone contracts, risks associated with currency exchange rates, risks associated with the company’s ability to integrate acquisitions, risks associated with labor shortages, risks associated with the development of new projects, including whether such projects will continue in the future, risks associated with the trading price of the company’s common shares, availability and cost of capital, risks associated with general global economic conditions, inflation, global weather conditions, natural disasters and security threats and changes to government and environmental regulations, including climate change, and other factors discussed in the “Management’s Discussion and Analysis of Financial Condition and Results of Operations” and “Risk Factors” sections of Civeo’s most recent annual report on Form 10-K and other reports the company may file from time to time with the U.S. Securities and Exchange Commission. Each forward-looking statement contained herein speaks only as of the date of this release. Except as required by law, Civeo expressly disclaims any intention or obligation to revise or update any forward-looking statements, whether as a result of new information, future events or otherwise.

Non-GAAP Financial Information

EBITDA is a non-GAAP financial measure that is defined as net income (loss) plus interest, taxes, depreciation and amortization, and Adjusted EBITDA is defined as EBITDA adjusted to exclude certain other unusual or non-operating items. Free cash flow is a non-GAAP financial measure that is defined as net cash flows provided by operating activities less capital expenditures plus proceeds from asset sales.

See “Non-GAAP Reconciliation” below for additional information concerning non-GAAP financial measures, including a reconciliation of the non-GAAP financial information presented in this press release to the most directly comparable financial information presented in accordance with GAAP. Non-GAAP financial information supplements and should be read together with, and is not an alternative or substitute for, the Company’s financial results reported in accordance with GAAP. Because non-GAAP financial information is not standardized, it may not be possible to compare these financial measures with other companies’ non-GAAP financial measures.

- Financial Schedules Follow -

CIVEO CORPORATION

UNAUDITED CONSOLIDATED STATEMENTS OF OPERATIONS

(in thousands, except per share amounts)


Three Months Ended


Nine Months Ended

September 30,

September 30,


2022


2021


2022


2021


Revenues

$

184,227


$

155,063


$

534,859


$

434,669


Costs and expenses:


Cost of sales and services


133,496


111,430


389,392


319,242


Selling, general and administrative expenses


17,677


17,320


50,572


46,204


Depreciation and amortization expense


22,608


20,282


65,818


62,928


Impairment expense


7,935


Other operating (income) expense


(339

)


21


(187

)


122


173,442


149,053


505,595


436,431


Operating income (loss)


10,785


6,010


29,264


(1,762

)


Interest expense


(3,001

)


(3,166

)


(8,077

)


(9,929

)

Loss on extinguishment of debt


(416

)


(416

)

Interest income


13


15


2


Other income


2,179


364


4,290


6,066


Income (loss) before income taxes


9,976


2,792


25,492


(6,039

)

Income tax expense


(3,713

)


(1,770

)


(7,091

)


(2,354

)

Net income (loss)


6,263


1,022


18,401


(8,393

)

Less: Net income attributable to noncontrolling interest


546


478


1,706


534


Net income (loss) attributable to Civeo Corporation


5,717


544


16,695


(8,927

)

Less: Dividends attributable to Class A preferred shares


492


482


1,469


1,440


Net income (loss) attributable to Civeo common shareholders

$

5,225


$

62


$

15,226


$

(10,367

)


Net income (loss) per share attributable to Civeo Corporation common shareholders:


Basic

$

0.32


$


$

0.92


$

(0.73

)

Diluted

$

0.32


$


$

0.91


$

(0.73

)


Weighted average number of common shares outstanding:


Basic


13,932


14,277


14,058


14,255


Diluted


14,064


14,361


14,220


14,255


CIVEO CORPORATION

CONDENSED CONSOLIDATED BALANCE SHEETS

(in thousands)


September 30,


December 31,

2022

2021


(UNAUDITED)


Current assets:


Cash and cash equivalents

$

8,361


$

6,282


Accounts receivable, net


122,280


114,859


Inventories


6,984


6,468


Assets held for sale


13,759


11,762


Prepaid expenses and other current assets


13,337


17,822


Total current assets


164,721


157,193


Property, plant and equipment, net


309,752


389,996


Goodwill, net


7,322


8,204


Other intangible assets, net


81,997


93,642


Operating lease right-of-use assets


14,267


18,327


Other noncurrent assets


5,270


5,372


Total assets

$

583,329


$

672,734


Current liabilities:


Accounts payable

$

46,225


$

49,321


Accrued liabilities


32,432


33,564


Income taxes


111


171


Current portion of long-term debt


27,964


30,576


Deferred revenue


2,092


18,479


Other current liabilities


8,900


4,807


Total current liabilities


117,724


136,918


Long-term debt


96,727


142,602


Deferred income taxes


7,344


896


Operating lease liabilities


11,669


15,429


Other noncurrent liabilities


13,668


13,778


Total liabilities


247,132


309,623


Shareholders' equity:


Preferred shares


63,410


61,941


Common shares


Additional paid-in capital


1,585,303


1,582,442


Accumulated deficit


(911,934

)


(912,951

)

Treasury stock


(9,063

)


(8,050

)

Accumulated other comprehensive loss


(394,408

)


(361,883

)

Total Civeo Corporation shareholders' equity


333,308


361,499


Noncontrolling interest


2,889


1,612


Total shareholders' equity


336,197


363,111


Total liabilities and shareholders' equity

$

583,329


$

672,734


CIVEO CORPORATION

UNAUDITED CONSOLIDATED STATEMENTS OF CASH FLOWS

(in thousands)


Nine Months Ended

September 30,


2022


2021


Cash flows from operating activities:


Net income (loss)

$

18,401


$

(8,393

)

Adjustments to reconcile net income (loss) to net cash provided by operating activities:


Depreciation and amortization


65,818


62,928


Impairment charges


7,935


Loss on extinguishment of debt


416


Deferred income tax expense


6,930


2,105


Non-cash compensation charge


2,861


2,933


Gains on disposals of assets


(4,069

)


(2,305

)

Provision (benefit) for credit losses, net of recoveries


(23

)


155


Other, net


2,397


2,436


Changes in operating assets and liabilities:


Accounts receivable


(19,138

)


(21,516

)

Inventories


(1,557

)


(193

)

Accounts payable and accrued liabilities


3,515


9,836


Taxes payable


(62

)


61


Other current assets and liabilities, net


(12,701

)


6,843


Net cash flows provided by operating activities


62,372


63,241


Cash flows from investing activities:


Capital expenditures


(17,466

)


(9,645

)

Proceeds from dispositions of property, plant and equipment


11,975


7,545


Other, net


190


Net cash flows used in investing activities


(5,301

)


(2,100

)


Cash flows from financing activities:


Term loan repayments


(23,059

)


(117,595

)

Revolving credit borrowings (repayments), net


(14,824

)


62,474


Debt issuance costs


(4,407

)

Repurchases of common shares


(14,209

)


(445

)

Taxes paid on vested shares


(1,013

)


(1,120

)

Net cash flows used in financing activities


(53,105

)


(61,093

)


Effect of exchange rate changes on cash


(1,887

)


(1,255

)

Net change in cash and cash equivalents


2,079


(1,207

)


Cash and cash equivalents, beginning of period


6,282


6,155


Cash and cash equivalents, end of period

$

8,361


$

4,948


CIVEO CORPORATION

SEGMENT DATA

(in thousands)

(unaudited)


Three Months Ended


Nine Months Ended

September 30,

September 30,


2022


2021


2022


2021

Revenues


Canada

$

103,009


$

84,057


$

307,984


$

229,223


Australia


73,805


65,118


205,154


188,774


United States


7,413


5,888


21,721


16,672


Total revenues

$

184,227


$

155,063


$

534,859


$

434,669


EBITDA (1)


Canada

$

25,567


$

19,801


$

71,445


$

53,201


Australia


16,858


14,835


47,832


35,157


United States


(33

)


(544

)


197


(1,468

)

Corporate and eliminations


(7,366

)


(7,914

)


(21,808

)


(20,192

)

Total EBITDA

$

35,026


$

26,178


$

97,666


$

66,698


Adjusted EBITDA (1)


Canada

$

25,567


$

19,801


$

71,445


$

53,201


Australia


16,858


14,835


47,832


43,092


United States


(33

)


(544

)


197


(1,468

)

Corporate and eliminations


(7,366

)


(7,914

)


(21,808

)


(20,192

)

Total adjusted EBITDA

$

35,026


$

26,178


$

97,666


$

74,633


Operating income (loss)


Canada

$

7,846


$

6,131


$

23,081


$

5,924


Australia


5,859


4,422


17,446


5,073


United States


(1,690

)


(2,124

)


(4,594

)


(5,831

)

Corporate and eliminations


(1,230

)


(2,419

)


(6,669

)


(6,928

)

Total operating income (loss)

$

10,785


$

6,010


$

29,264


$

(1,762

)


(1) Please see Non-GAAP Reconciliation Schedule.


CIVEO CORPORATION

NON-GAAP RECONCILIATIONS

(in thousands)

(unaudited)


Three Months Ended


Nine Months Ended

September 30,

September 30,


2022


2021


2022


2021


EBITDA (1)

$

35,026


$

26,178


$

97,666


$

66,698

Adjusted EBITDA (1)

$

35,026


$

26,178


$

97,666


$

74,633

Free Cash Flow (2)

$

38,595


$

31,035


$

56,881


$

61,141

(1)

The term EBITDA is defined as net income (loss) attributable to Civeo Corporation plus interest, taxes, depreciation and amortization. The term Adjusted EBITDA is defined as EBITDA adjusted to exclude certain other unusual or non-operating items. EBITDA and Adjusted EBITDA are not measures of financial performance under generally accepted accounting principles and should not be considered in isolation from or as a substitute for net income or cash flow measures prepared in accordance with generally accepted accounting principles or as a measure of profitability or liquidity. Additionally, EBITDA and Adjusted EBITDA may not be comparable to other similarly titled measures of other companies. Civeo has included EBITDA and Adjusted EBITDA as supplemental disclosures because its management believes that EBITDA and Adjusted EBITDA provide useful information regarding its ability to service debt and to fund capital expenditures and provide investors a helpful measure for comparing Civeo's operating performance with the performance of other companies that have different financing and capital structures or tax rates. Civeo uses EBITDA and Adjusted EBITDA to compare and to monitor the performance of its business segments to other comparable public companies and as a benchmark for the award of incentive compensation under its annual incentive compensation plan.


The following table sets forth a reconciliation of EBITDA and Adjusted EBITDA to net income (loss) attributable to Civeo Corporation, which is the most directly comparable measure of financial performance calculated under generally accepted accounting principles (in thousands) (unaudited):


Three Months Ended


Nine Months Ended

September 30,

September 30,


2022


2021


2022


2021


Net income (loss) attributable to Civeo Corporation

$

5,717


$

544


$

16,695


$

(8,927

)

Income tax expense


3,713


1,770


7,091


2,354


Depreciation and amortization


22,608


20,282


65,818


62,928


Interest income


(13

)


(15

)


(2

)

Loss on extinguishment of debt


416


416


Interest expense


3,001


3,166


8,077


9,929


EBITDA

$

35,026


$

26,178


$

97,666


$

66,698


Adjustments to EBITDA


Impairment of long-lived assets (a)


7,935


EBITDA and Adjusted EBITDA

$

35,026


$

26,178


$

97,666


$

74,633


(a) Relates to asset impairments in the second quarter of 2021. In the second quarter of 2021, we recorded a pre-tax loss related to the impairment of long-lived assets in our Australian segment of $7.9 million, which is included in Impairment expense on the unaudited statements of operations.

(2)

The term Free Cash Flow is defined as net cash flows provided by operating activities less capital expenditures plus proceeds from asset sales. Free Cash Flow is not a measure of financial performance under generally accepted accounting principles and should not be considered in isolation from or as a substitute for cash flow measures prepared in accordance with generally accepted accounting principles or as a measure of profitability or liquidity. Additionally, Free Cash Flow may not be comparable to other similarly titled measures of other companies. Civeo has included Free Cash Flow as a supplemental disclosure because its management believes that Free Cash Flow provides useful information regarding the cash flow generating ability of its business relative to its capital expenditure and debt service obligations. Civeo uses Free Cash Flow to compare and to understand, manage, make operating decisions and evaluate Civeo's business. It is also used as a benchmark for the award of incentive compensation under its annual incentive compensation plan.


The following table sets forth a reconciliation of Free Cash Flow to Net Cash Flows Provided by Operating Activities, which is the most directly comparable measure of financial performance calculated under generally accepted accounting principles (in thousands) (unaudited):


Three Months Ended


Nine Months Ended

September 30,

September 30,


2022


2021


2022


2021


Net Cash Flows Provided by Operating Activities

$

38,741


$

33,891


$

62,372


$

63,241


Capital expenditures


(8,819

)


(3,389

)


(17,466

)


(9,645

)

Proceeds from dispositions of property, plant and equipment


8,673


533


11,975


7,545


Free Cash Flow

$

38,595


$

31,035


$

56,881


$

61,141


Contacts

Carolyn J. Stone
Civeo Corporation
Senior Vice President & Chief Financial Officer
713-510-2400


Read full story here

Offshore Source Logo

Offshore Source keeps you updated with relevant information concerning the Offshore Energy Sector.

Any views or opinions represented on this website belong solely to the author and do not represent those of the people, institutions or organizations that Offshore Source or collaborators may or may not have been associated with in a professional or personal capacity, unless explicitly stated.

Corporate Offices

Technology Systems Corporation
8502 SW Kansas Ave
Stuart, FL 34997

info@tscpublishing.com